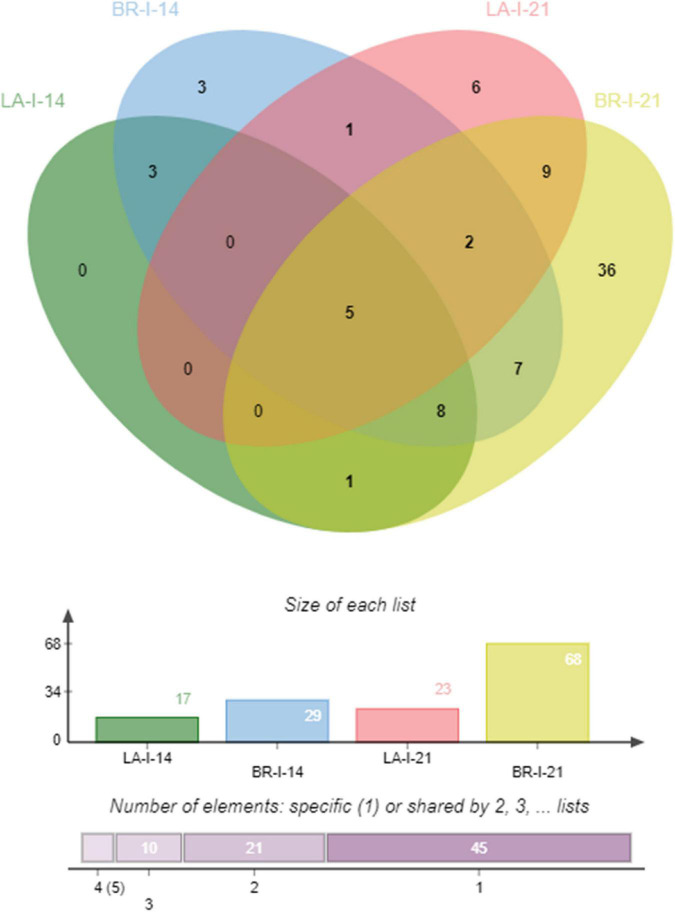
FIGURE 3.
Venn diagram of consistently regulated transcripts corresponding to secreted proteins. The Venn diagram depicts the number of P. brassicae transcripts with common, opposite and distinct expression patterns coming from the two B. napus hosts at 14 and 21 dai. LA-I-21 = ‘Laurentian’ inoculated 21 dai; BR-I-21 = ‘Brutor’ inoculated 21 dai.

