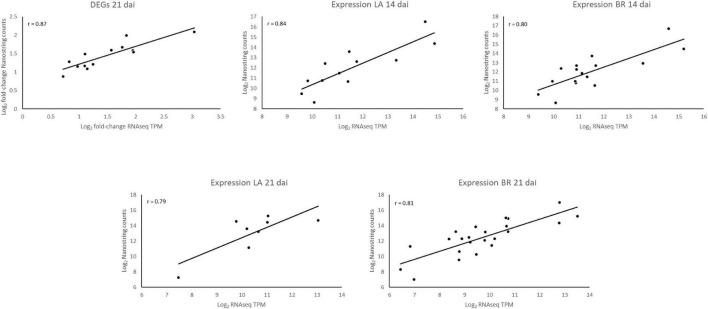
FIGURE 6.
Validation of RNAseq data using nCounter Nanostrings technology. We evaluated 28 target genes which were either differentially expressed 21 dai or consistently expressed in both cultivars at 14 and 21 dai. As seen from the graphs, not all scatter plots have the same number of points, which reflects different amounts of genes evaluated under the different analyses according to the obtained results. (LA) P. brassicae genes coming from the interaction with ‘Laurentian,’ (BR) P. brassicae genes coming from the interaction with ‘Brutor,’ (DEGs) Differentially Expressed Genes.

