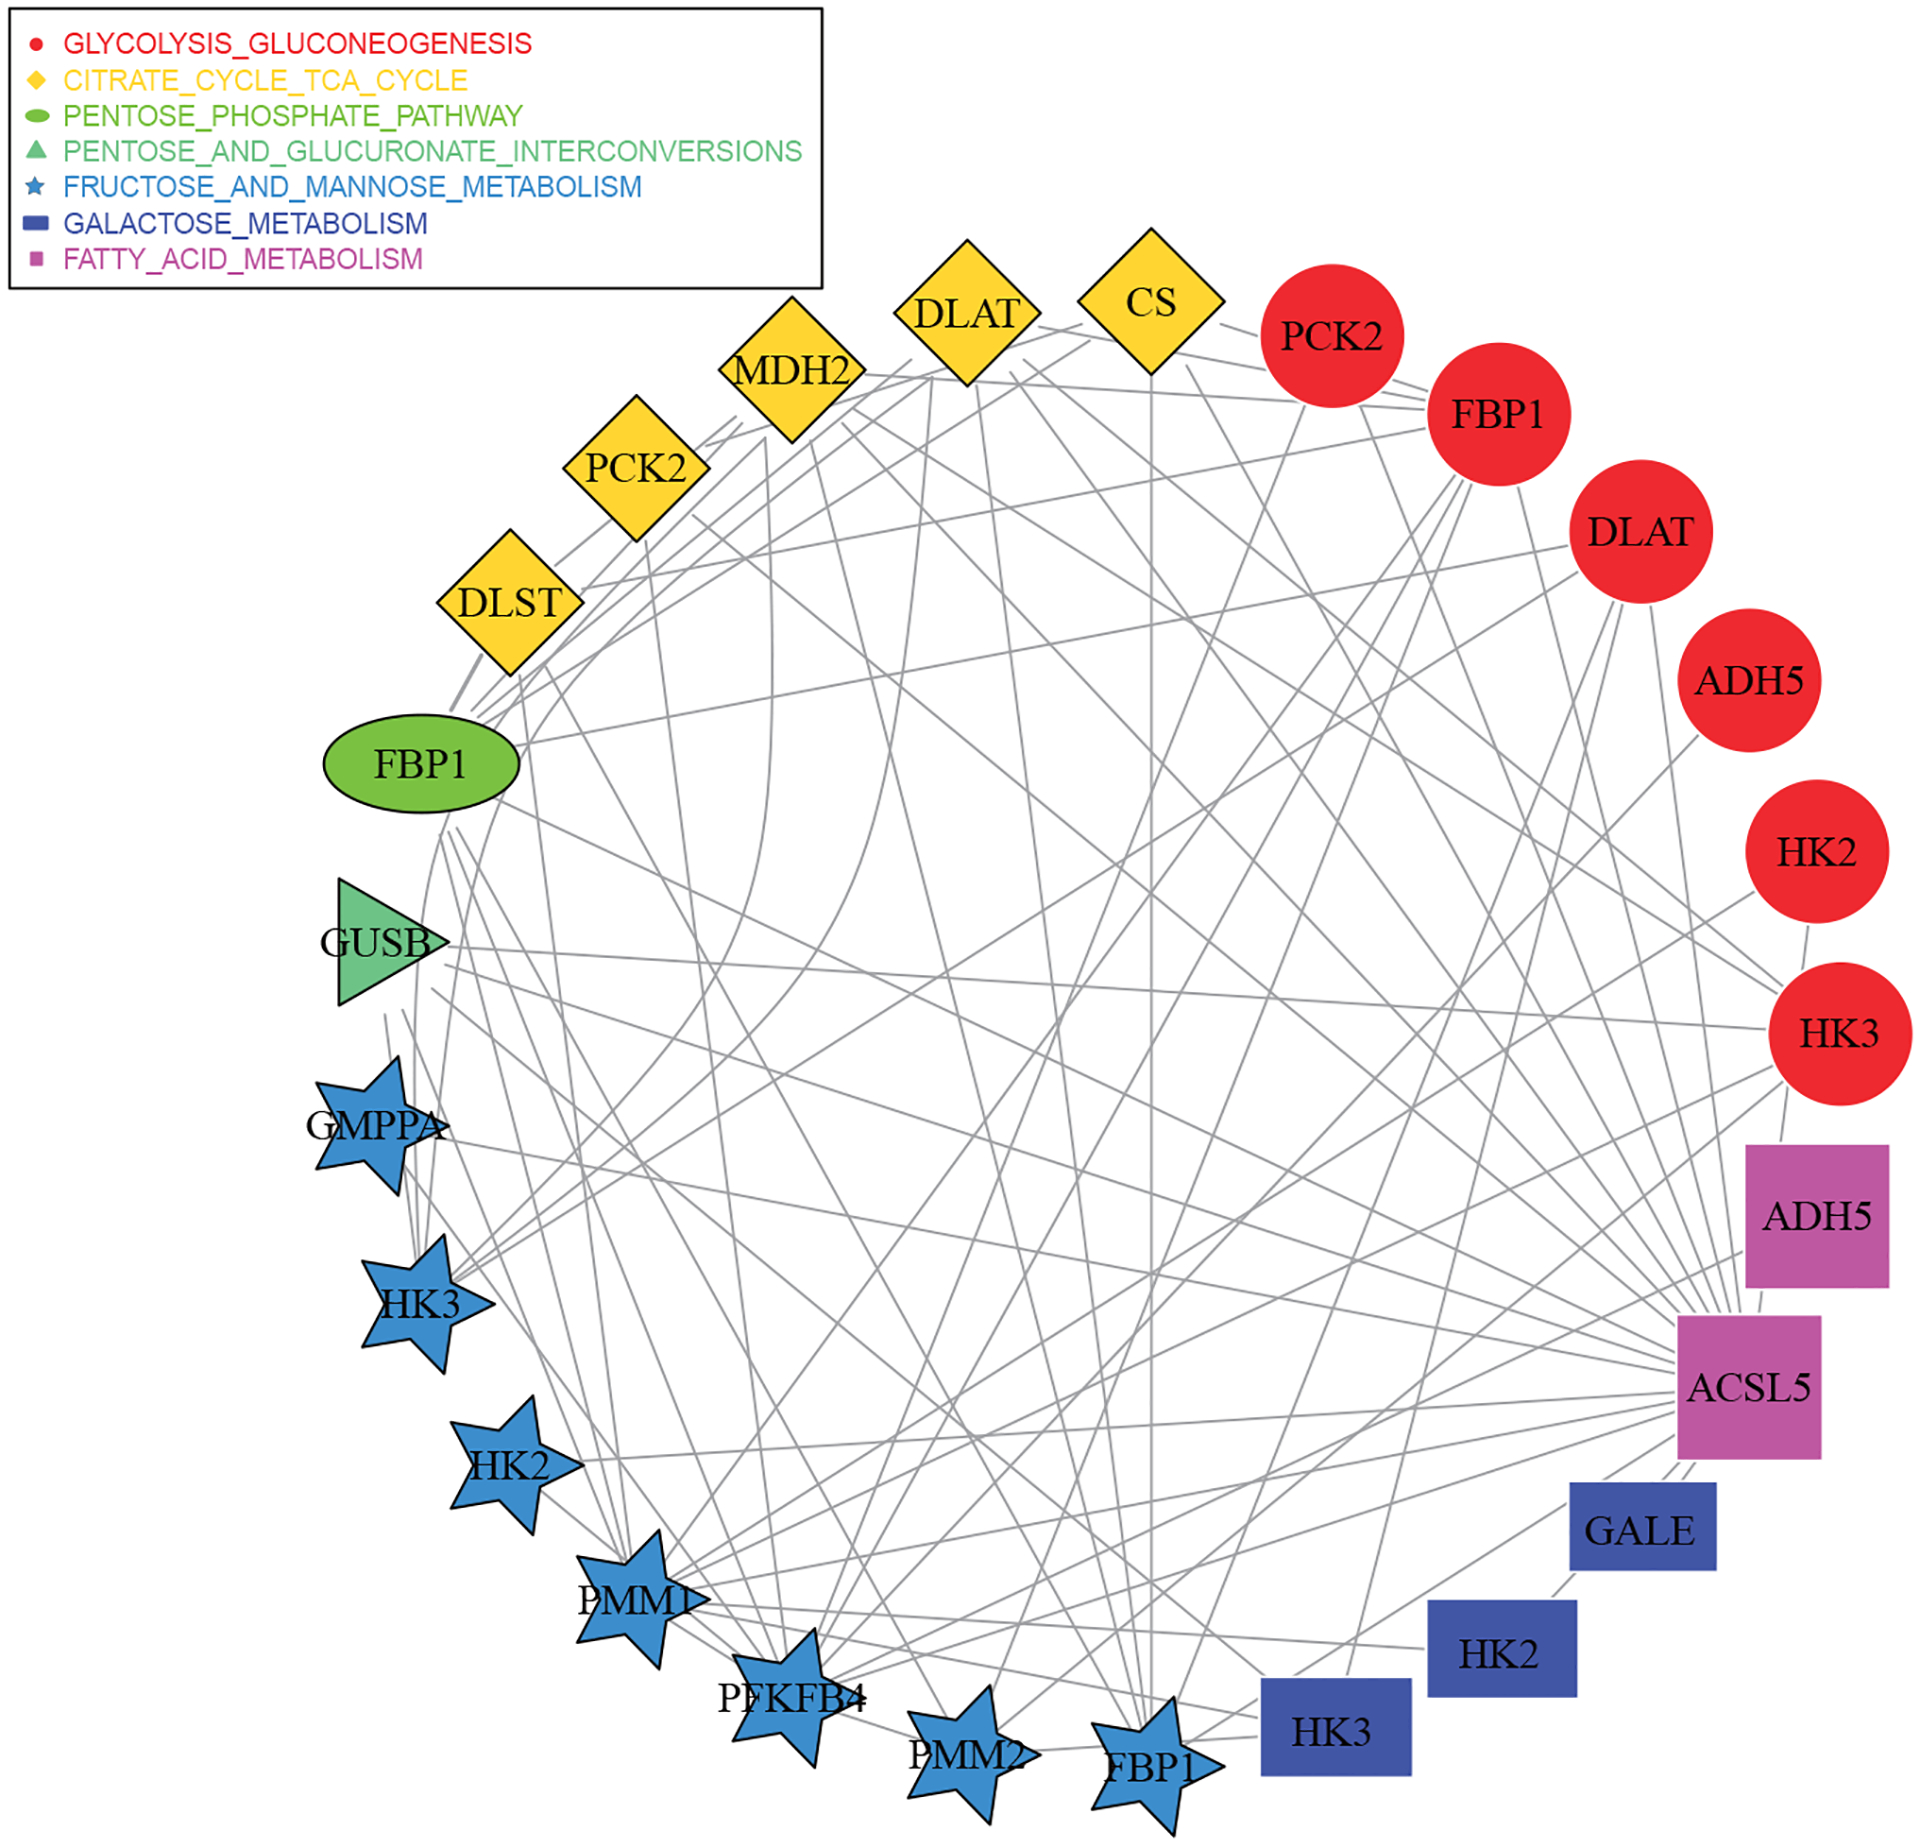
FIGURE 2.

Analysis of the TCGA SKCM data using the proposed approach: identified main genetic effects, interactions, and networks. Genes in different networks are represented by different shapes, and two genes are connected if the corresponding interaction is also selected.
