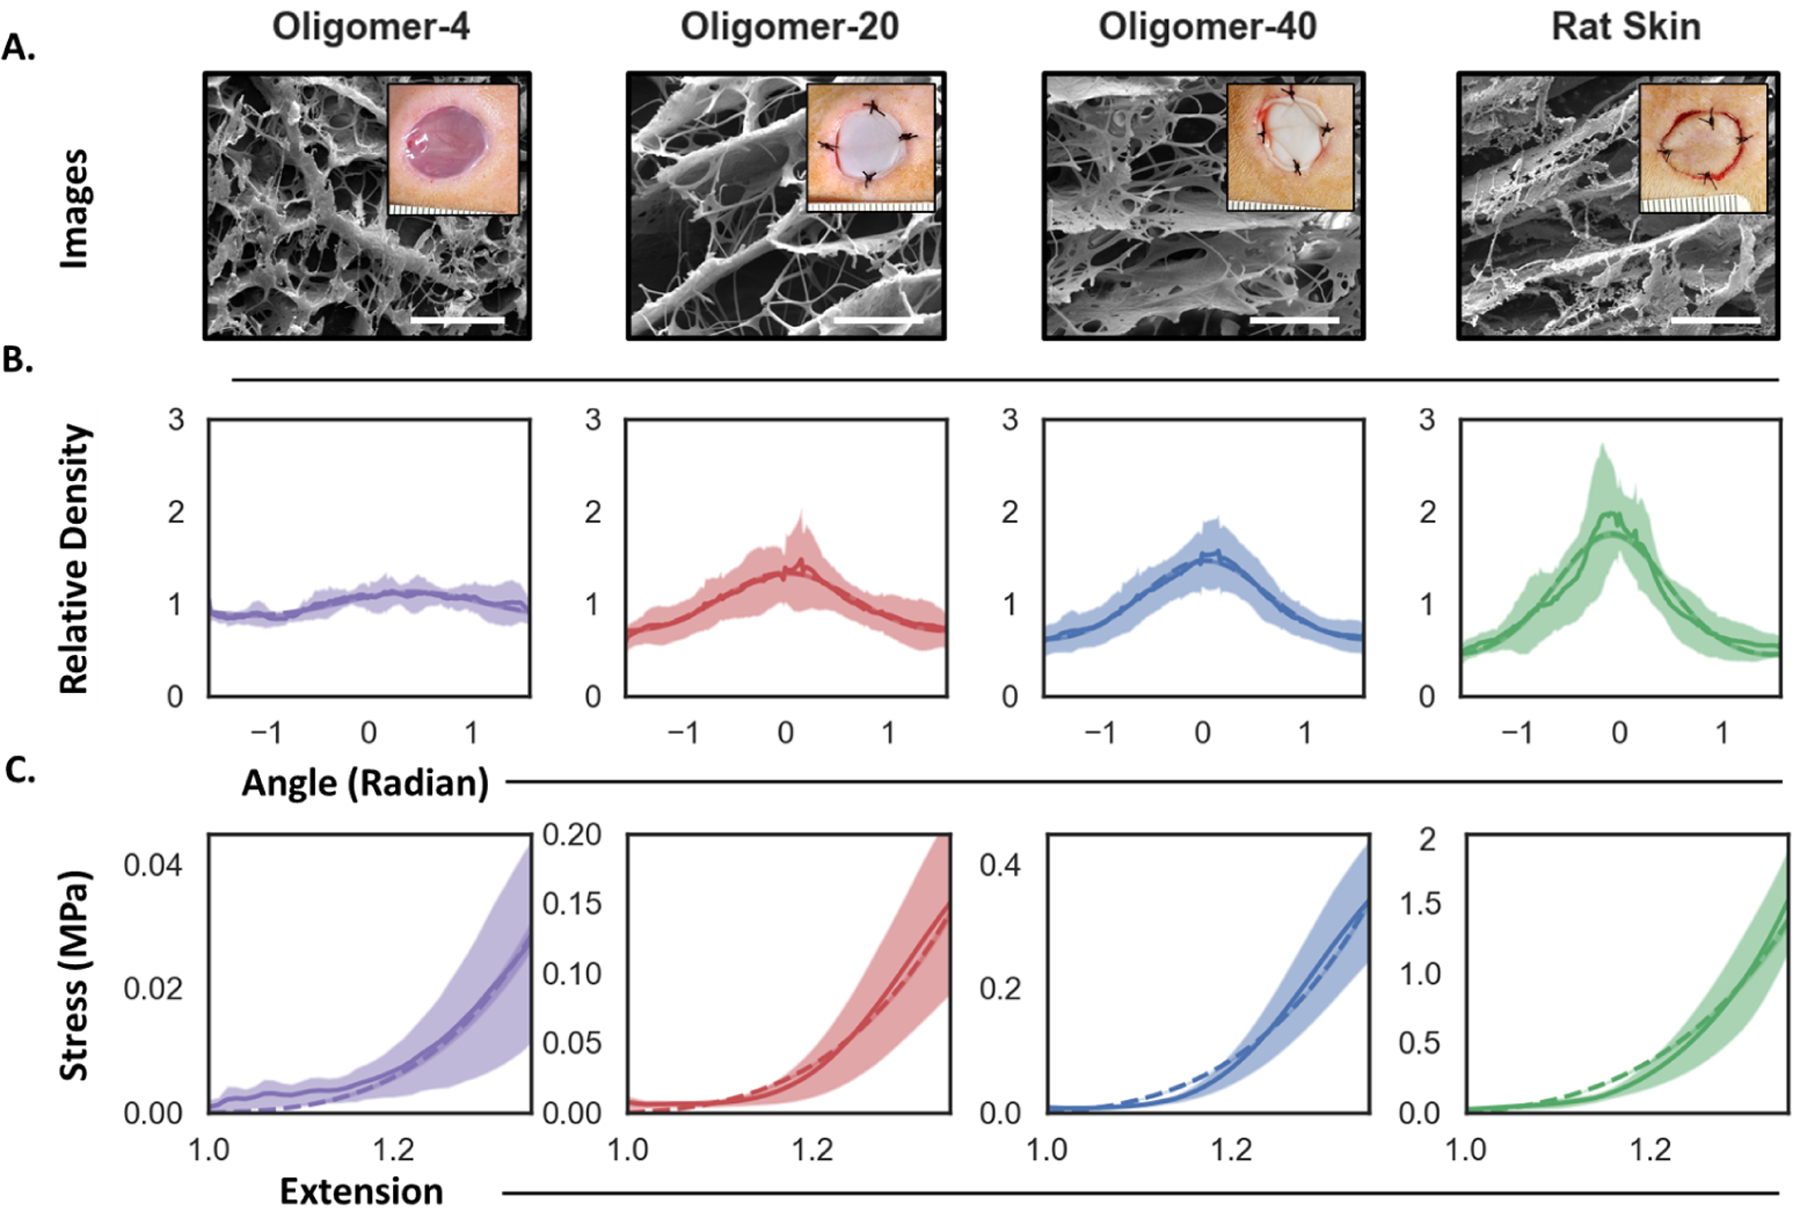
Figure 4:

Comparison of collagen microstructure and uniaxial stress-strain plots for Oligomer scaffolds and rat skin. A. Cryo-SEM images of collagen microstructure. Inset shows gross images of scaffolds and rat skin autograft placed within experimental in vivo wounds. Scale bar: 5μm. B.-C. Model calibration results from Bayesian analysis. B. Collagen fiber orientation and dispersion measurements (solid lines indicate mean and shaded region indicate standard deviation) and associated posterior prediction from the calibrated periodic von Mises distribution (dashed lines denote the maximum a posteriori estimate). C. Stress-strain measurements (solid lines and shaded region) and Bayesian posterior prediction using the exponential strain energy based on the structural tensor of fiber orientation (dashed lines).
