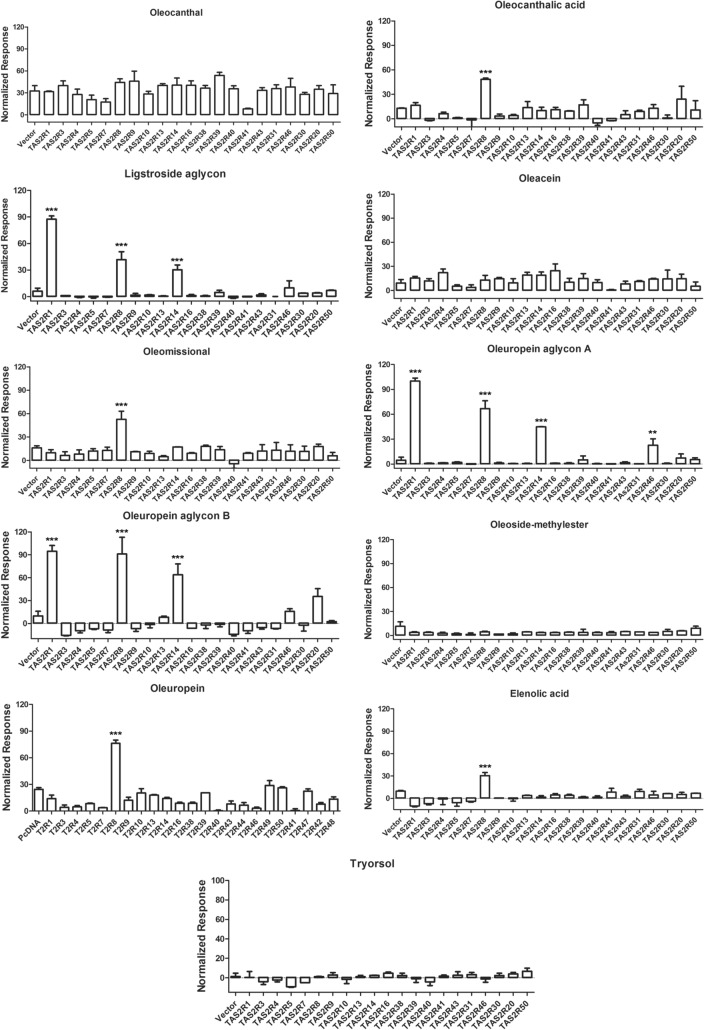
Figure 3.
Phenolic compound bitter taste activity tests on hTAS2Rs. Relative fluorescence signals caused by phenolic compound activation of the receptors and the empty vector as a negative control. The concentration of the compounds used was [300 µM], except for Ligstroside aglycon and Oleuropein aglycon [200 µM], oleuropein that was [3 mM]. The asterisks indicate significant differences tested by one-way ANOVA (***p < 0.0001) (N = 2). Data represent mean ± SD.

