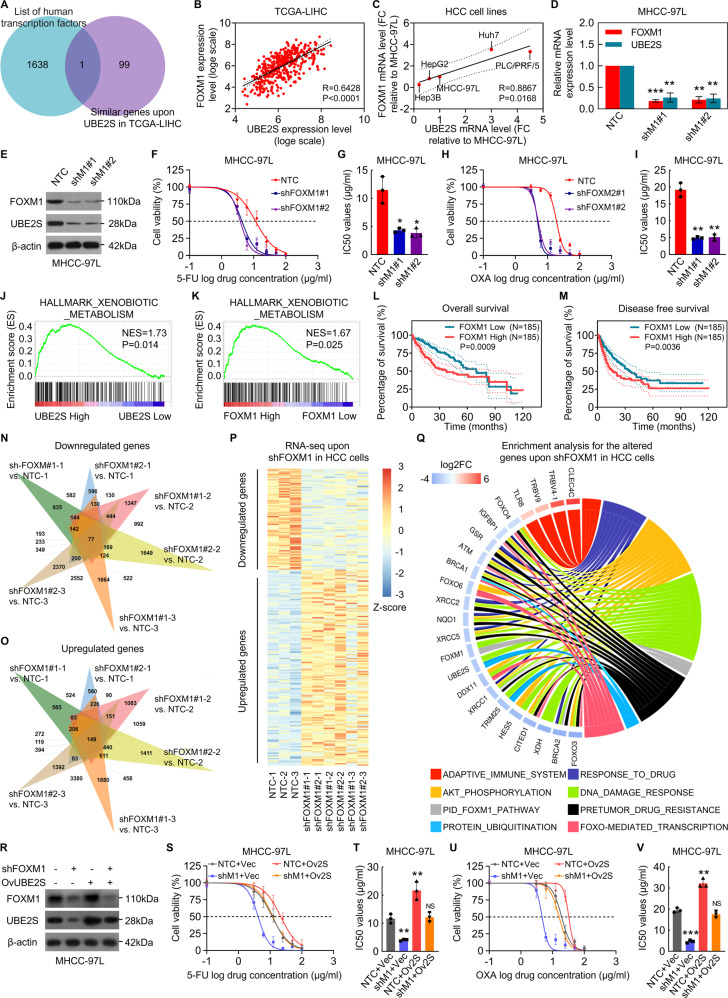
Fig. 3. UBE2S is a critical effector for transcription factor FOXM1 in regulation of HCC cell chemoresistance.
A The overlap between human transcription factors and UBE2S co-expressed genes in TCGA-LIHC database is displayed in a Venn diagram. B, C Analyses show linear regressions and Pearson correlations between UBE2S and FOXM1 transcript levels in HCC tissues in TCGA database (B) and in five different HCC cell lines (C). D, E UBE2S mRNA (D) and protein levels (E) were investigated in FOXM1-knockdown MHCC-97L cells. F–I Cytotoxic effects of 5-FU (F, G) and oxaliplatin (H, I) on FOXM1-knockdown MHCC-97L cells and corresponding NTC cells were determined, respectively. J, K Gene Set Enrichment Analysis (GSEA) plots show the enrichment of gene signatures involved in processing of cytotoxic agents and other xenobiotics between the HCC tissues with UBE2Shigh and UBE2Slow (J), or the HCC tissues with FOXM1high and FOXM1low (K). L, M The OS (L) and DFS (M) curves for patients with HCC are shown based on FOXM1 transcript levels in HCC tissues in TCGA-LIHC cohorts. N, O Venn diagrams show significantly down- (N) and upregulated (O) DEGs (≥2 folds) in FOXM1 knockdown MHCC-97L cell as compared with NTC cells (n = 3). P A heat map of down- and upregulated DEGs between NTC and FOXM1-knockdown MHCC-97L cells (n = 3). Q A chord plot for the biological process enrichment involved by the down- and upregulated DEGs between NTC and FOXM1-knockdown MHCC-97L cells. R– V MHCC-97L cells were infected with the indicated lentiviral constructs, and then UBE2S and FOXM1 protein levels (R) and cytotoxic effects upon 5-FU (S, T) and oxaliplatin (U, V) were investigated.

