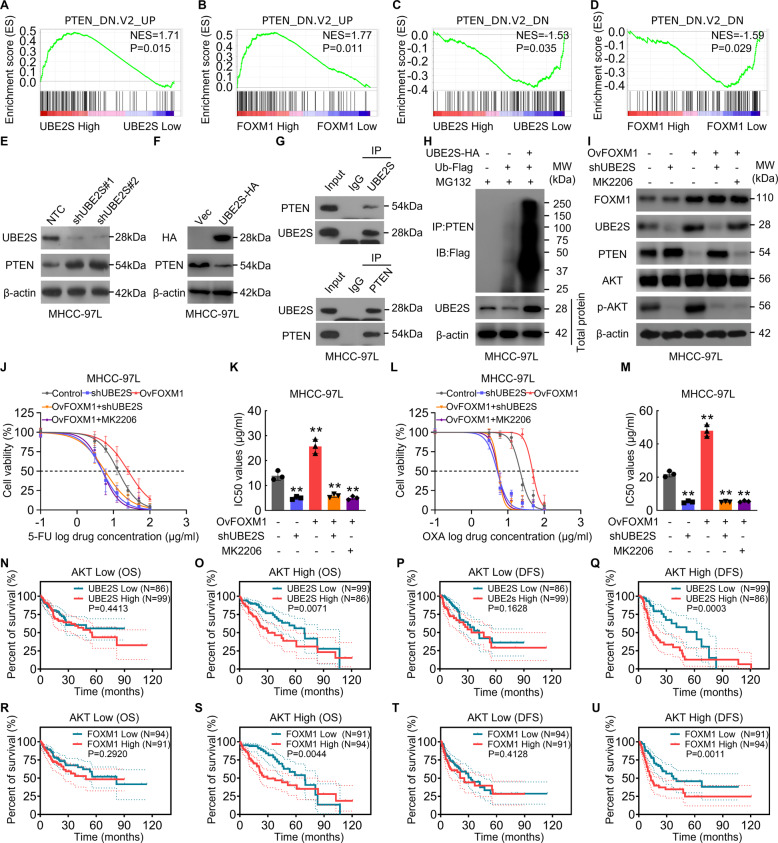
Fig. 5. UBE2S promotes the ubiquitination of PTEN, enhancing HCC cell chemoresistance by activating AKT pathway.
A, B GSEA plots show the enrichment of gene upregulated in cancer cells upon the knockdown of PTEN between the HCC tissues with UBE2Shigh and UBE2Slow (A), or between the HCC tissues with FOXM1high and FOXM1low (B). C, D GSEA plots show the enrichment of gene downregulated in PTEN-knockdown cancer cells between the HCC tissues with UBE2Shigh and UBE2Slow (C), or between the HCC tissues with FOXM1high and FOXM1low (D). E, F PTEN protein levels were investigated in UBE2S-knockdown (E) or UBE2S-overexpression (F) MHCC-97L cells. G UBE2S (Upper) and PTEN (Lower) complexes were co-immunoprecipitated with UBE2S and PTEN antibodies and immunoblotted with the indicated antibodies. H MHCC-97L cells overexpressed indicated proteins were treated with MG132 (10 μM) for 8 h, and the ubiquitination levels of PTEN protein were investigated. I–M MHCC-97L cells infected with indicated lentiviral plasmids and treated with MK2206 (5 μM) or DMSO (control) for 8 h. The indicated protein levels (I) and cytotoxic effects upon 5-FU (J, K) and oxaliplatin (L, M) were investigated. N, O The OS curves based on UBE2S transcript levels between HCC subgroup of AKT low (N) or high (O) expression. P, Q The DFS curves based on UBE2S transcript levels between HCC subgroup of AKT low (P) or high (Q) expression. R, S The OS curves based on FOXM1 transcript levels between HCC subgroup of AKT low (N) or high (O) expression. T, U The DFS curves based on FOXM1 transcript levels in HCC subgroup of AKT low (T) or high (U) expression.

