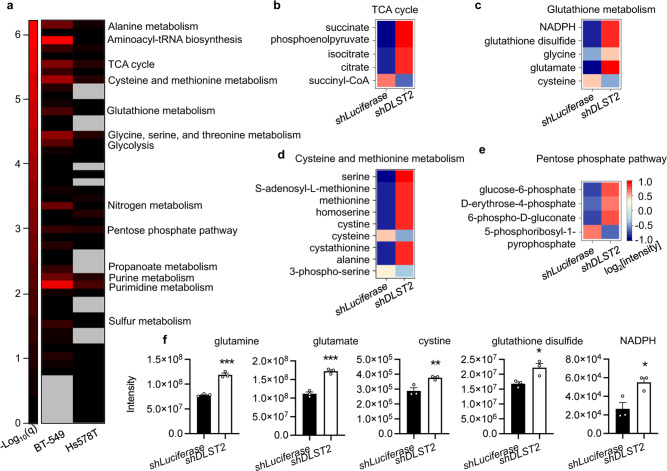
Fig. 4. DLST knockdown significantly alters multiple metabolic pathways in DLST-dependent TNBC cells while minimally affecting independent ones.
a Pathway enrichment analysis of unlabeled metabolomics profiling data in BT-549 and Hs578T cells. Missing values were represented by gray color. The enrichment score is represented as −log10(q-value). b–e The log2 values of normalized metabolite intensity in the pathways indicated are shown as the heatmap for BT549 cells (n = 3 independent experiments): TCA cycle (b), glutathione metabolism (c), cysteine and methionine metabolism (d), and pentose phosphate pathway (e). f Representative metabolites related to redox balance are shown in BT-549 cells after DLST knockdown (n = 3). Data are presented as mean ± s.e.m, and an unpaired two-tailed t-test was used for statistical comparison. *P ≤ 0.05, **P ≤ 0.01, ***P ≤ 0.001.

