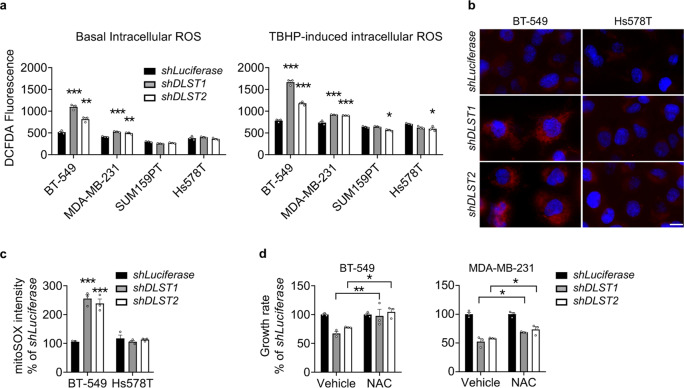
Fig. 5. DLST depletion induces ROS production in DLST-dependent human TNBC cells.
a In the late evening of day 4 post-transduction, ROS levels in four TNBC cell lines are measured using 2,7′-dichlorofluorescin diacetate (DCFDA) dye with (right) or without (left) TBHP treatment (n = 3; representative data from three independent experiments). Statistical differences were calculated using one-way ANOVA. b, c Mitochondrial ROS levels analyzed by mitoSOX staining in BT-549 and Hs578T cells in the presence or absence of DLST knockdown in the evening of day 4 post-transduction. Representative images of mitoSOX staining (b; red overlaid with DAPI staining) and image quantification (c) are shown (n = 3; representative data from three independent experiments). Scale bar = 10 µm. Statistical differences were calculated using two-way ANOVA. d Treatment with a ROS scavenger, NAC, restores the growth of BT-549 cells (left) while moderately rescues the growth of MDA-MB-231 cells (right) in the presence of DLST inactivation (n = 3; representative data from three independent experiments). Statistical differences were calculated using two-way ANOVA. Data in (a, c, d) are presented as mean ± s.e.m. *P ≤ 0.05, **P ≤ 0.01, ***P ≤ 0.001.

