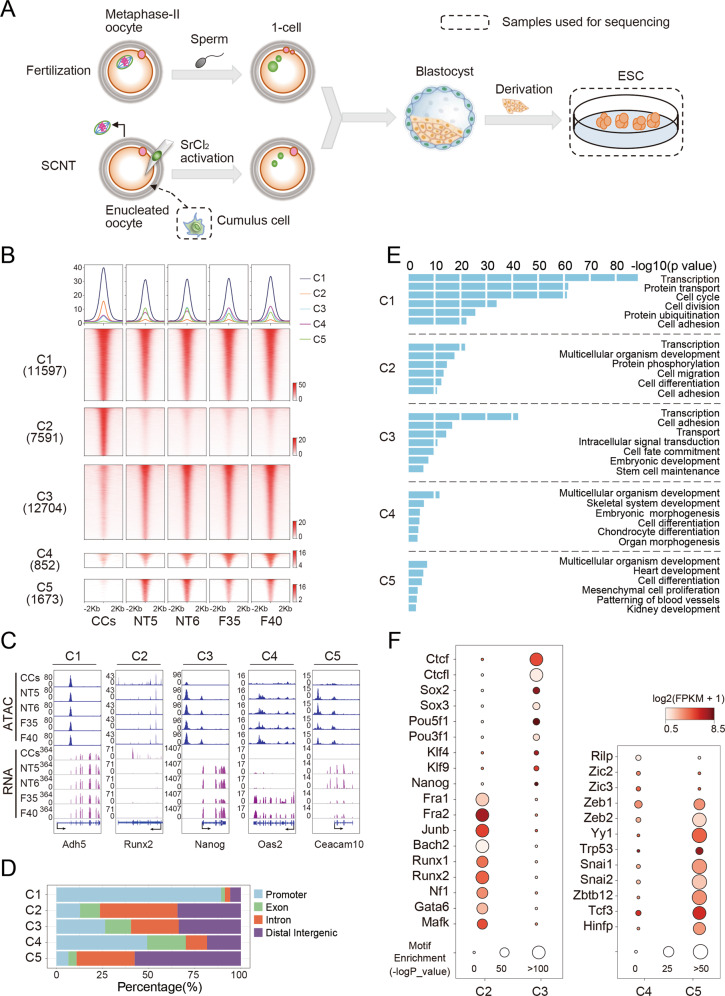
Fig. 1. The dynamic changes of global chromatin accessibility of ntESCs.
A Schematic of fESCs and ntESCs derivation. Blastocysts were obtained from fertilized and SCNT embryos, respectively. fESCs and ntESCs were derived from corresponding blastocysts in vitro and further collected for sequencing. B Heatmap of the ATAC-seq profiles. ATAC-seq peaks were classified into three clusters (C1, C2, C3) by K-means according to peak intensities in CCs, NT5, NT6, F35, and F40. The C3 peaks with intensity difference between ntESCs and fESCs were further identified (Supplemental Materials). The peaks with significantly higher intensities in fESCs were defined as C4, and the peaks with reserve intensity trend were defined as C5. Each row represents a locus (ATAC-seq peak center ± 2 Kb), and the red gradient color indicates the ATAC-seq signal intensity. Average tag densities of the identified clusters (midnight blue = C1, coral = C2, sky blue = C3, dark magenta = C4, green= C5) are shown on the top. C Examples for ATAC-seq peak clusters. Chromatin regions, Adh5 (chr3: 138443093–138455499), Runx2 (chr17: 44,495,987–44,814,797), Nanog (chr6: 122,707,489–122,714,633), Oas2 (chr5: 120,730,333–120,749,853) and Ceacam10 (chr7: 24,777,206–24,784,657), were selected as examples to show the ATAC-seq and RNA-seq data of CCs, NT5, NT6, F35 and F40 in each clusters. D Bar graphs showing the localizations of the ATAC-seq peaks in different clusters. ATAC-seq peaks within TSS ± 1 Kb were considered as promoters and those not located in promoters, exons and introns were labeled as intergenic regulatory elements. E Bar plot showing the enriched pathways of ATAC-seq peaks in each cluster (C1, C2, C3, C4 and C5). F Dot plots showing the enriched TFs motifs and the gene expressions (y-axis) in the different ATAC-seq peak clusters (x-axis). Circle size represents the motif enrichment, and the gradient red color indicates the relative gene expressions.

