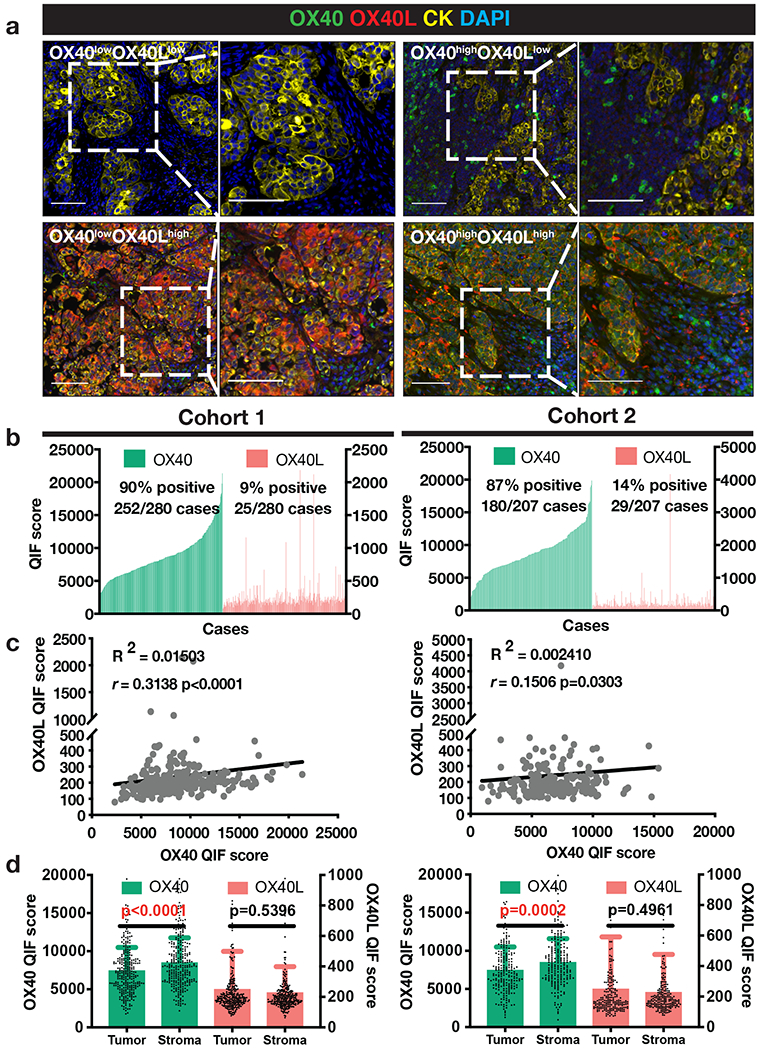
Figure 1. Distribution and localization of OX40 and OX40L expression in human NSCLC.

(a) Representative multiplexed quantitative immunofluorescence (QIF) micrographs of human NSCLC cases with varying expression levels of OX40 (green) and OX40L (red). Cytokeratin (CK) (yellow) marks tumor epithelial cells and DAPI (blue) marks all nuclei. Scale bar=100 μm. (b) QIF score distributions of OX40 and OX40L arranged by increasing order of OX40 expression in Cohort 1 (N=280) and Cohort 2 (N=207) of human NSCLC cases. QIF scores on the left Y-axis refer to OX40 and on the right to OX40L. (c) Spearman correlation between total OX40 and OX40L levels in Cohorts 1 and 2. (d) OX40 and OX40L QIF scores (mean ± SD) in Cohorts 1 and 2 across tumor and stroma compartments. Statistical analysis by Mann-Whitney test.
