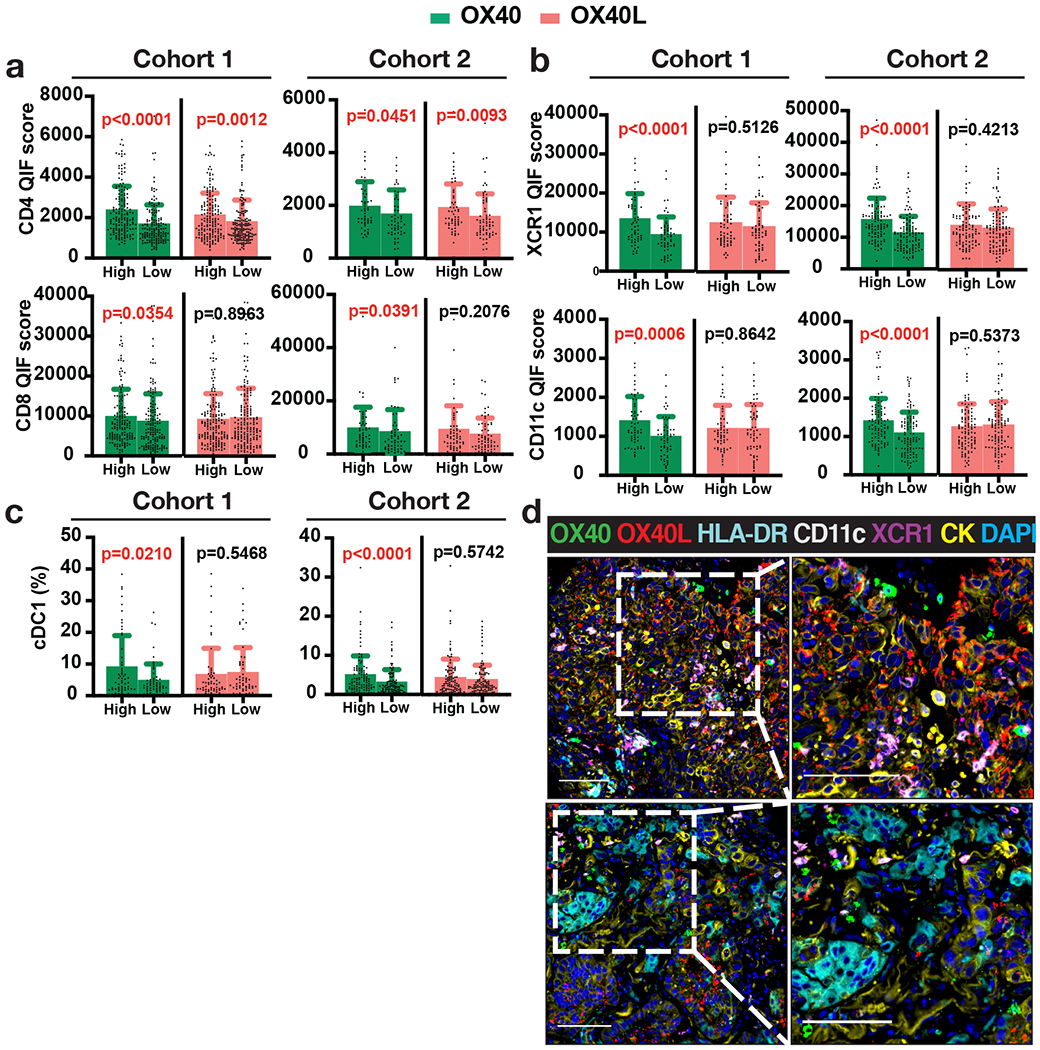
Figure 2. Association of OX40 and OX40L levels with immune markers.

(a-c) Quantification of immune markers in Cohorts 1 and 2 divided into OX40 or OX40L High and Low groups using median cut-point: QIF scores (mean ± SD) of (a) TIL markers CD4 and CD8, (b) cDC1 markers XCR1 and CD11c, and (c) percentages of cDC1 (XCR1+ CD11c+ HLA-DR+) (number of cDC1/total number of cells). Statistical analysis by Mann-Whitney test. (d) Representative images of cases with OX40/OX40L-high levels, marked by high infiltration of cross-presenting dendritic cells positive for markers XCR1, CD11c, and HLA-DR (upper panel), and OX40/OX40L-low levels accompanied by low abundance of XCR1- and CD11c-expressing cells (lower panel).
