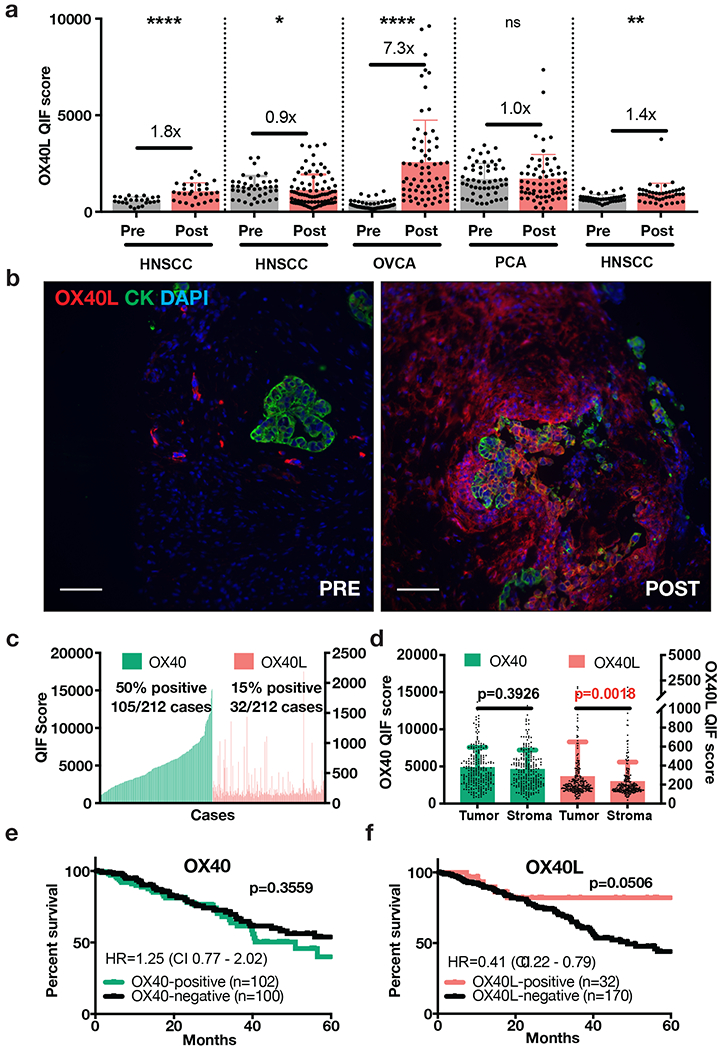
Figure 5. OX40L detection in patient biopsies pre- and post-exogenous OX40L injection, and expression of the OX40 pathway and survival in patients with primary serous carcinomas.

(a) OX40L QIF scores for pre- and post-exogenous OX40L (mRNA-2416) injection biopsies of patients with HNSCC (head-and-neck squamous cell carcinoma), OVCA (ovarian cancer), and PCA (prostate cancer). Post- treatment biopsies were collected 24 to 48 hours after injection of mRNA-2416. Also shown are the protein level changes based on pre/post-treatment scores. Each dot indicates the OX40L protein QIF score obtained from each individual 20X field of view in the whole tissue section specimen. Statistical analysis performed by unpaired t-test or Mann-Whitney test. ****p<0.0001. **p<0.01. *p<0.05.
(b) Pre- and post-administration biopsies of LNP-formulated mRNA encoding OX40L (mRNA-2416) in patient with ovarian cancer (QIF scores shown in Figure 5a) where OX40L was detected at the highest levels 48 hours after treatment. Scale bar=100 μm.
(c) QIF score distributions of OX40 and OX40L arranged by increasing order of OX40 expression in a retrospective cohort of 212 human primary serous carcinomas. QIF scores on the left Y-axis refer to OX40 and on the right to OX40L.
(d) OX40 and OX40L QIF scores (mean ± SD) in tumor and stromal compartments. Statistical analysis by Mann-Whitney test.
(e-f) Kaplan-Meier analysis of the 5-year overall survival in human primary uterine/ovarian serous carcinomas with high or low OX40 (e) and OX40L (f) protein levels. Statistical analysis performed by Mantel-Cox/Log-rank test reporting Hazard ratios (HR) (log-rank) and confidence intervals (CI).
