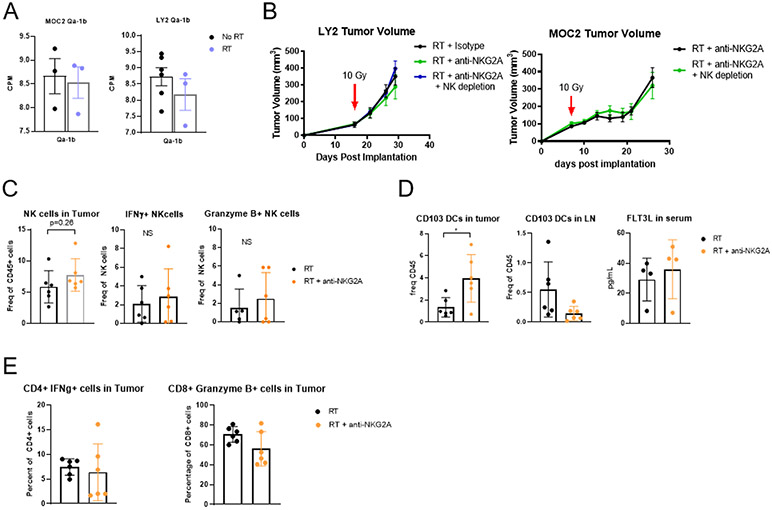
Figure 1.
(A) Bulk RNAseq data from MOC2 and LY2 tumors showing the expression levels of Qa-1b 7 days after RT in the MOC2 model and 10 days after RT in the LY2 model; n=4. (B) Tumor volumes in mice bearing MOC2 and Ly2 tumors treated with RT and anti-NKG2A and either depleted or not depleted of NK cells; n=7. (C) Flow Cytometric analysis of NK cell populations in MOC2 tumors 3 days after RT and anti-NKG2A therapy shown as frequency of parent population; n=6. (D) Flow Cytometric analysis of DC populations in MOC2 tumors and ELISA analysis of FLT3L levels in serum 3 days after RT and anti-NKG2A therapy; n=6. (E) Flow Cytometric analysis of effector T cell populations in MOC2 tumors 3 days after RT and anti-NKG2A therapy; n=6.

