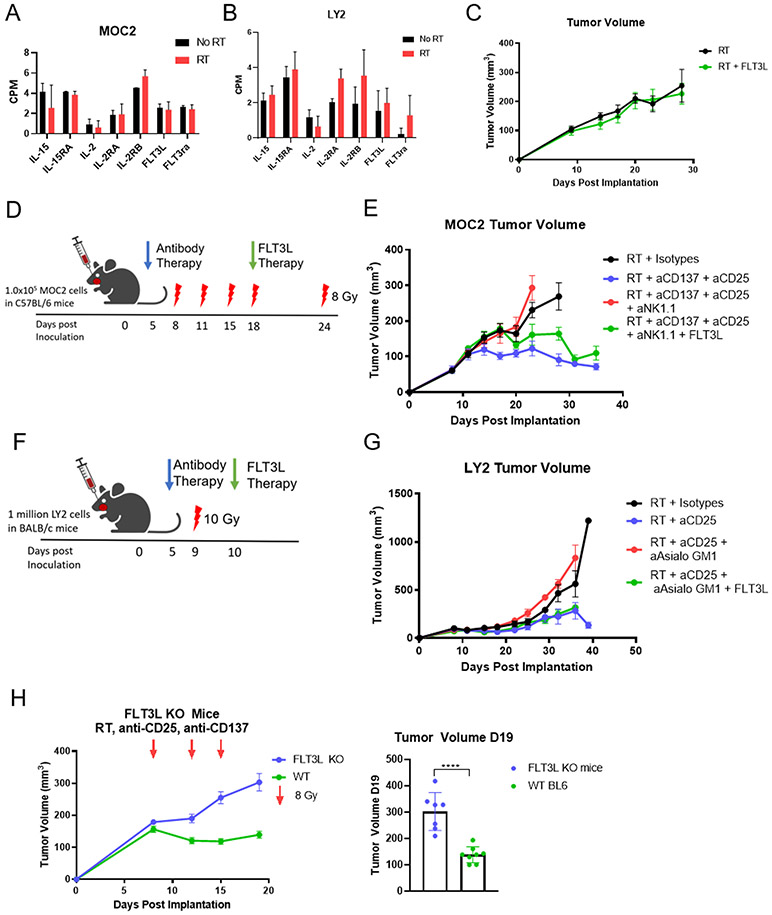
Figure 2.
(A) Bulk RNAseq analysis of MOC2 tumors showing IL-15, IL-15RA, IL-2, IL-2RA, IL-2RB, FLT3L, and FLT3RA production in MOC2 tumors 7 days after RT; n=4. (B) Bulk RNAseq analysis of LY2 tumors showing IL-15, IL-15RA, IL-2, IL-2RA, IL-2RB, FLT3L, and FLT3RA production in LY2 tumors 10 days after RT; n=4. (C) MOC2 tumor volumes of mice treated with RT (8 Gy) on days 9, 18, and 22 with FLT3L HDT therapy starting on day 11; n=7. (D) Schematic of MOC2 experiment in C57BL/6 mice depicts days of 8 Gy RT (red lightning bolts), beginning of antibody therapy at day 4 (blue arrow), and FLT3L therapy at day 18 (i.p. injection daily for 10 days) (green arrow); n=7. (E) MOC2 tumor volumes of C57BL/6 mice treated with RT and isotype control (black line), anti-CD137 and anti-CD25 (blue line), anti-CD137 and anti-CD25 with NK cells depleted (red line), and anti-CD137 and anti-CD25 with NK cells depleted plus FLT3L therapy (green line); n=7. (F) Schematic of LY2 experiment in BALB/c mice depicts 10 Gy of RT at day 9 (red lightning bolt), beginning of antibody therapy at day 5 (blue arrow), and FLT3L therapy at day 10 (Hydrodynamic injection) (green arrow). (G) LY2 tumor volumes of BALB/c mice after treatment with RT and isotypes (black line), anti-CD25 (blue line), anti-CD25 with NK cells depleted (red line), anti-CD25 with NK cells depleted plus FLT3L HDT therapy (green line); n=7. (H) Tumor volumes on days 6, 12, 15, 19 (left panel) and on day 19 (right panel) in wild type C57BL/6 (green line) and FLT3L knockout (blue symbols) mice treated twice weekly with RT + anti-CD25 + anti-CD137 and 8 Gy buccal irradiation on days 8, 12, and 15; ****p≤0.0001; n=7.

