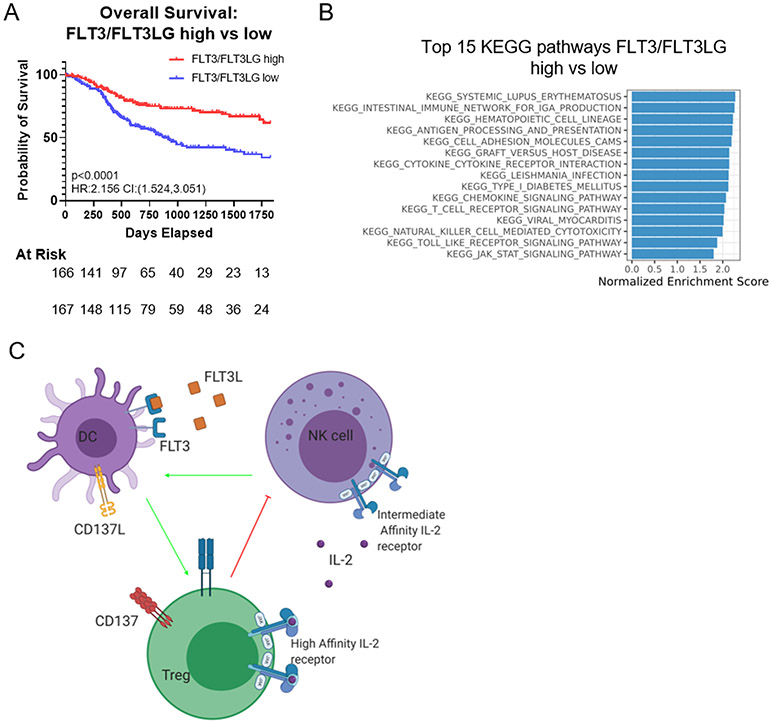
Figure 6.
(A) Overall survival of patients with high expression of both FLT3LG and FLT3 to patients with low expression of FLT3LG/FLT3. (B) Waterfall plot showing KEGG pathways upregulated in patients with high expression of both FLT3 and FLT3LG. all pathways displayed are top 15 pathways and have calculated adjusted p<0.001 as generated by fgsea. (C) Schematic depicting the interaction between NK cells, DCs, and Tregs in the TME and the cytokines that govern their interactions. In both the LY2 and MOC2 models NK cells are key, as the effect of therapy is removed upon their depletion, and can be rescued by FLT3L therapy. NK cells can be stimulated by IL-2, and play a critical role in producing FLT3L to activate DCs. DCs, once activated by FLT3L, increase tumor surveillance and T cell activation. Tregs play a negative role through IL-2 sequestration.

