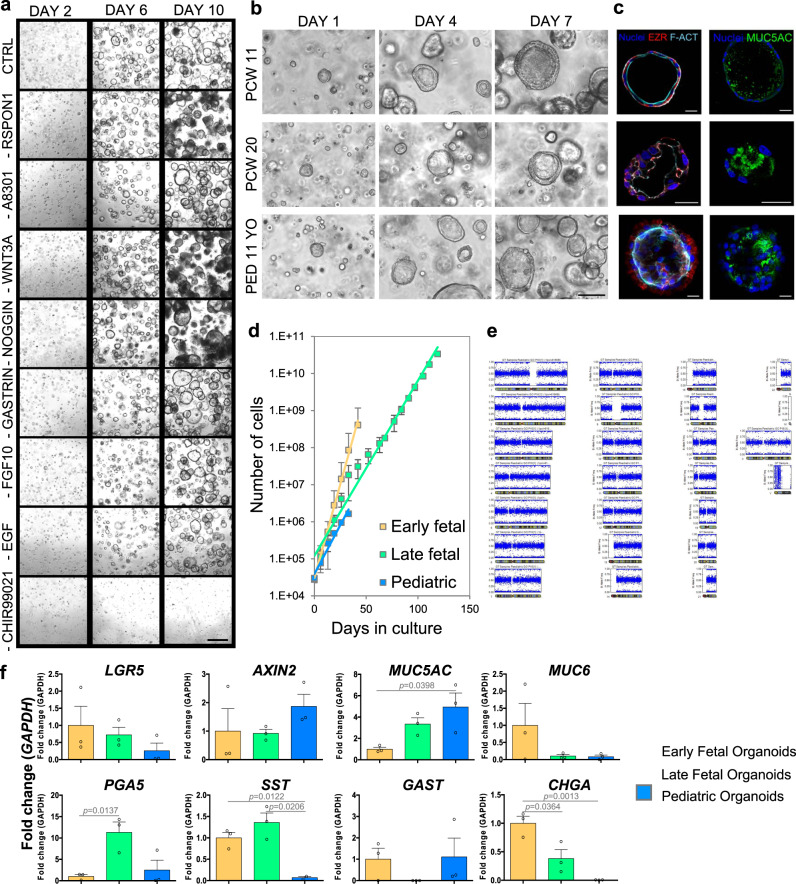
Fig. 2. Fetal gastric organoid derivation, expansion, and characterization.
a Selective withdrawal of gastric organoid cytokines from control (CTRL) complete medium, in CS 23 (mid-week 8) organoid line split at single cells at passage 7. Scale bar 400 μm. b Bright field images of representative organoid line for each of the 3 stages, showing the formation of spherical organoids within 7 days starting from single cells. Scale bar 100 μm. c Immunofluorescence panel showing ezrin (EZR) in red, f-actin (F-ACT) in cyan, mucin 5AC (MUC5AC) in green, and nuclei in blue (Hoechst). Scale bars 25 μm. d Cumulative cell counts during days of culture. Mean ± SD (n = 4 biological replicates for early and late fetal, n = 3 for pediatric organoids). e Single-nucleotide polymorphism (SNP) array for pediatric organoids. Representative image of the chromosome viewer and allele frequency. f Real-time PCR analysis of early fetal, late fetal, and pediatric gastric organoids. Relative fold change to GAPDH. Mean ± SEM (n = 3). Black circles on the bar charts represent single biological replicates. Ordinary one-way ANOVA.

