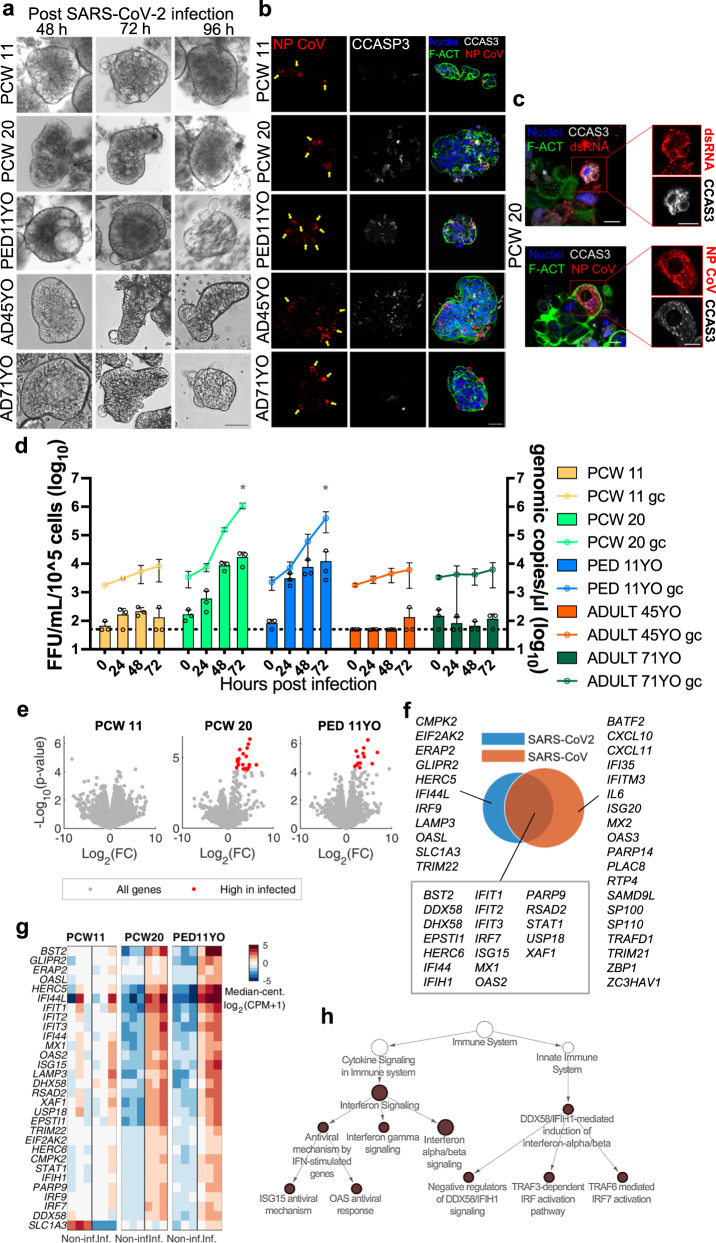
Fig. 5. SARS-CoV-2 infection of undifferentiated reverse polarity organoids human gastric organoids.
a Bright field images of RP-GOs infected with pediatric patient-derived SARS-CoV-2 for 2 h, and acquired at 48, 72 and 96 h post-infection. Scale bar 50 μm. b Infected cells in RP-GOs fixed at 96 h post-infection. Immunofluorescence panel showing SARS-CoV-2 Nucleocapsid Antibody (NP CoV) in red, marking infected cells (yellow arrows), cleaved caspase 3 (CCAS3) in white, marking apoptotic cells, f-actin (F-ACT) in green, and nuclei in blue (Hoechst). Image is representative of at least five similar organoid images. Scale bar 50 μm. c Infected cell details in RP-GOs fixed at 96 h post-infection. Immunofluorescence panel showing viral double strand RNA J2 (dsRNA) in red, SARS-CoV-2 Nucleocapsid Antibody (NP CoV) in red, cleaved caspase 3 (CCAS3) in white, f-actin (F-ACT) in green, and nuclei in blue (Hoechst). Scale bars 10 μm. d Graph of SARS-CoV-2 replication in fetal, pediatric, and adult undifferentiated RP-GOs. Live virus yield was titrated by FFA on Vero E6 cells of culture supernatants collected at 0, 24, 48 and 72 h after infection with SARS-CoV-2 (MOI of 0.5). The dotted line indicates the lower limit of detection. Black circles indicate single data points. Mean ± SD (n = 3 experimental replicates). Two-way ANOVA correction for multiple comparison using statistical hypothesis testing: Tukey test 0.002; p-value < 0,001. e–h RNA-seq analysis highlights differential response to infection in organoids derived from different developmental stages. e Volcano plots indicating DEG genes of non-infected vs. infected sample comparisons at each developmental stage (PCW 11, PCW 20, 11-years-old pediatric). f Venn diagram of DEGs that responded differently to the infection in any developmental stage in this study and DEGs identified in a literature survey of transcriptomic data on SARS-CoV transfected samples50. g Hierarchical clustering of DEG genes included in f, data were median-centered for each pair of non-infected and infected conditions. h Results from an enrichment analysis within Reactome database of DEGs highlighted in e. Symbol size is proportional to number of genes. Uncorrected p-value < 10−5, from the right-sided hypergeometric test. White symbols were not enriched and were added to highlight the hierarchy between categories within Reactome structure.

