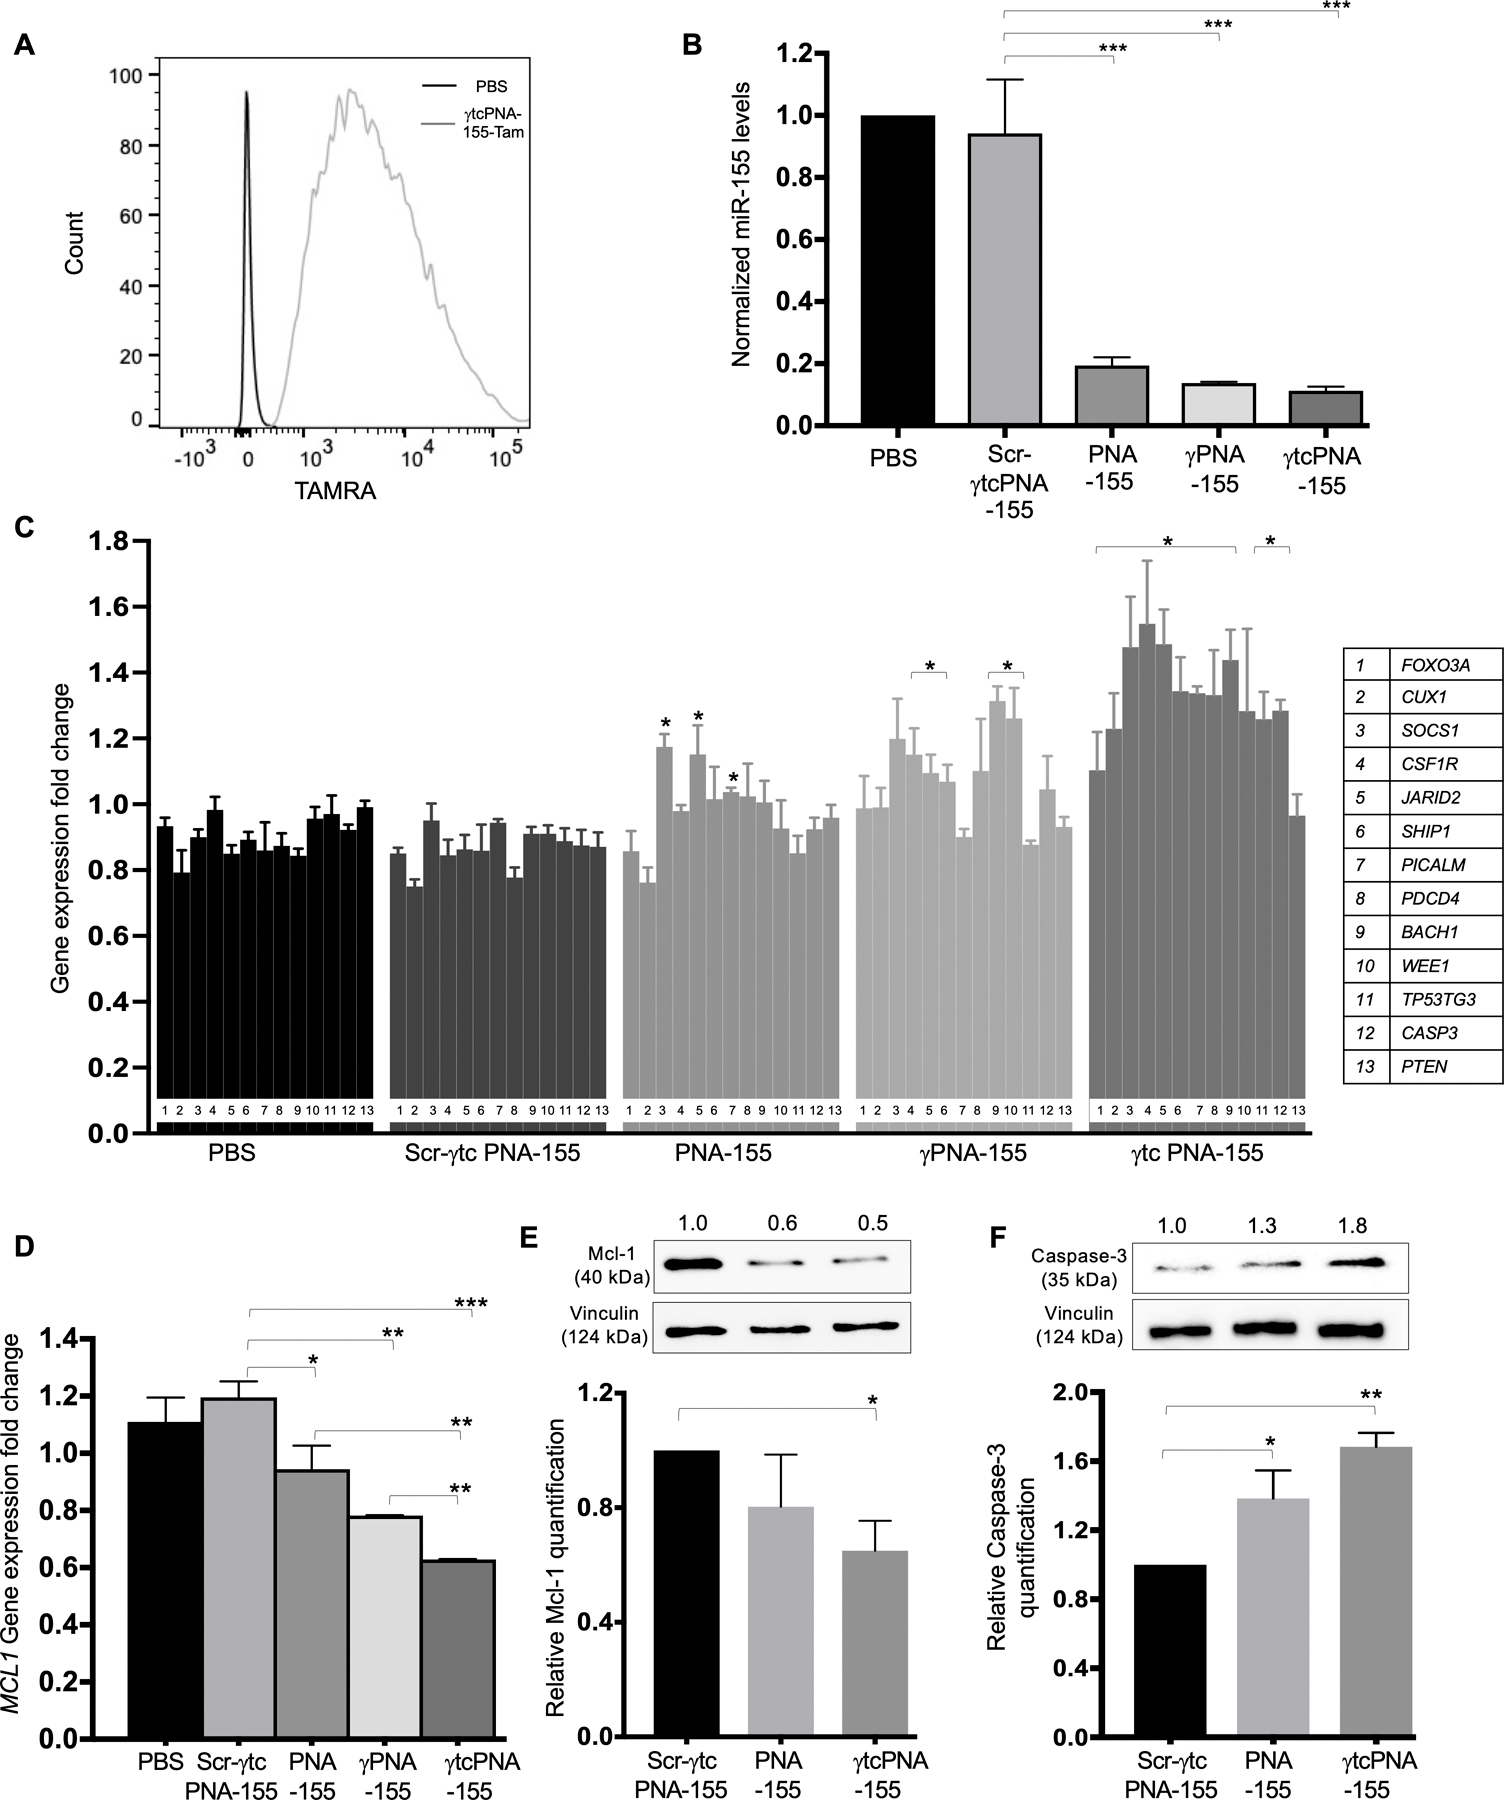
Figure 2. Cell culture-based functional assay in U2932 lymphoma cells.

(A) γtcPNA-155-TAMRA uptake in the U2932 lymphoma cell line: Representative flow cytometry traces of TAMRA fluorescence in U2932 cells after treatment with 500 nM dose of γtcPNA-155-TAMRA for 48 hours. The data was analyzed by FlowJo software (B) Normalized miR-155 gene expression levels in U2932 after treatment with phosphate buffer saline (PBS) as a control and with 500 nM dose of Scr-γtcPNA-155, PNA-155, γPNA-155 and γtcPNA-155 for 48 hours compared to average control U6 (n=3), data represented as mean ± standard error mean (SEM), Statistical analysis was performed using Unpaired two-tailed t-test. Further, statistical analysis was performed relative to Scr-γtcPNA-155 treated cells. ***p<0.001. (C) Gene expression level of miR-155 downstream genes, tumor suppressor proteins (FOXO3A, CUX1, SOCS1, CSF1R, JARID2, SHIP1, PICALM, PDCD4, BACH1, WEE1, TP53TG3, CASP3, PTEN) in U2932 cell line after treatment with PBS as a control and with after treatment with 500 nM of Scr-γtcPNA-155, PNA-155, γPNA-155 and γtcPNA-155 for 48 hours. Data is normalized with average GAPDH control (n=3), and represented as mean ± SEM, *p<0.05. Unpaired two-tailed t-test was used for statistical analysis and analysis was performed relative to Scr-γtcPNA-155 treated cells. (D) Gene expression level of miR-155 downstream genes MCL1 in U2932 cell line after treatment with PBS as a control and 500 nM of Scr-γtcPNA-155, PNA-155, γPNA-155 and γtcPNA-155 for 48 hours. Data is normalized with average GAPDH control (n=3), and represented as mean ± SEM, *p<0.05, **p<0.01 and ***p<0.001. Statistical analysis was performed using Unpaired two-tailed t-test. Analysis was performed relative to Scr-γtcPNA-155 treated cells. (E) Representative western blot of Mcl-1 and its quantification (n=3 technical replicate) and (F) Caspase-3 protein and its quantification (n=3 technical replicate) in U2932 cell line after treatment with 500 nM of Scr-γtcPNA-155, PNA-155 and γtcPNA-155 for 48 hours. Data is represented as mean ± SEM and unpaired two-tailed t-test was used for statistical analysis. * p<0.05 **p <0.01. Numbers above western blot panels represent relative quantification of the respective bands using ImageJ software, and normalized relative to loading control and treatment control.
