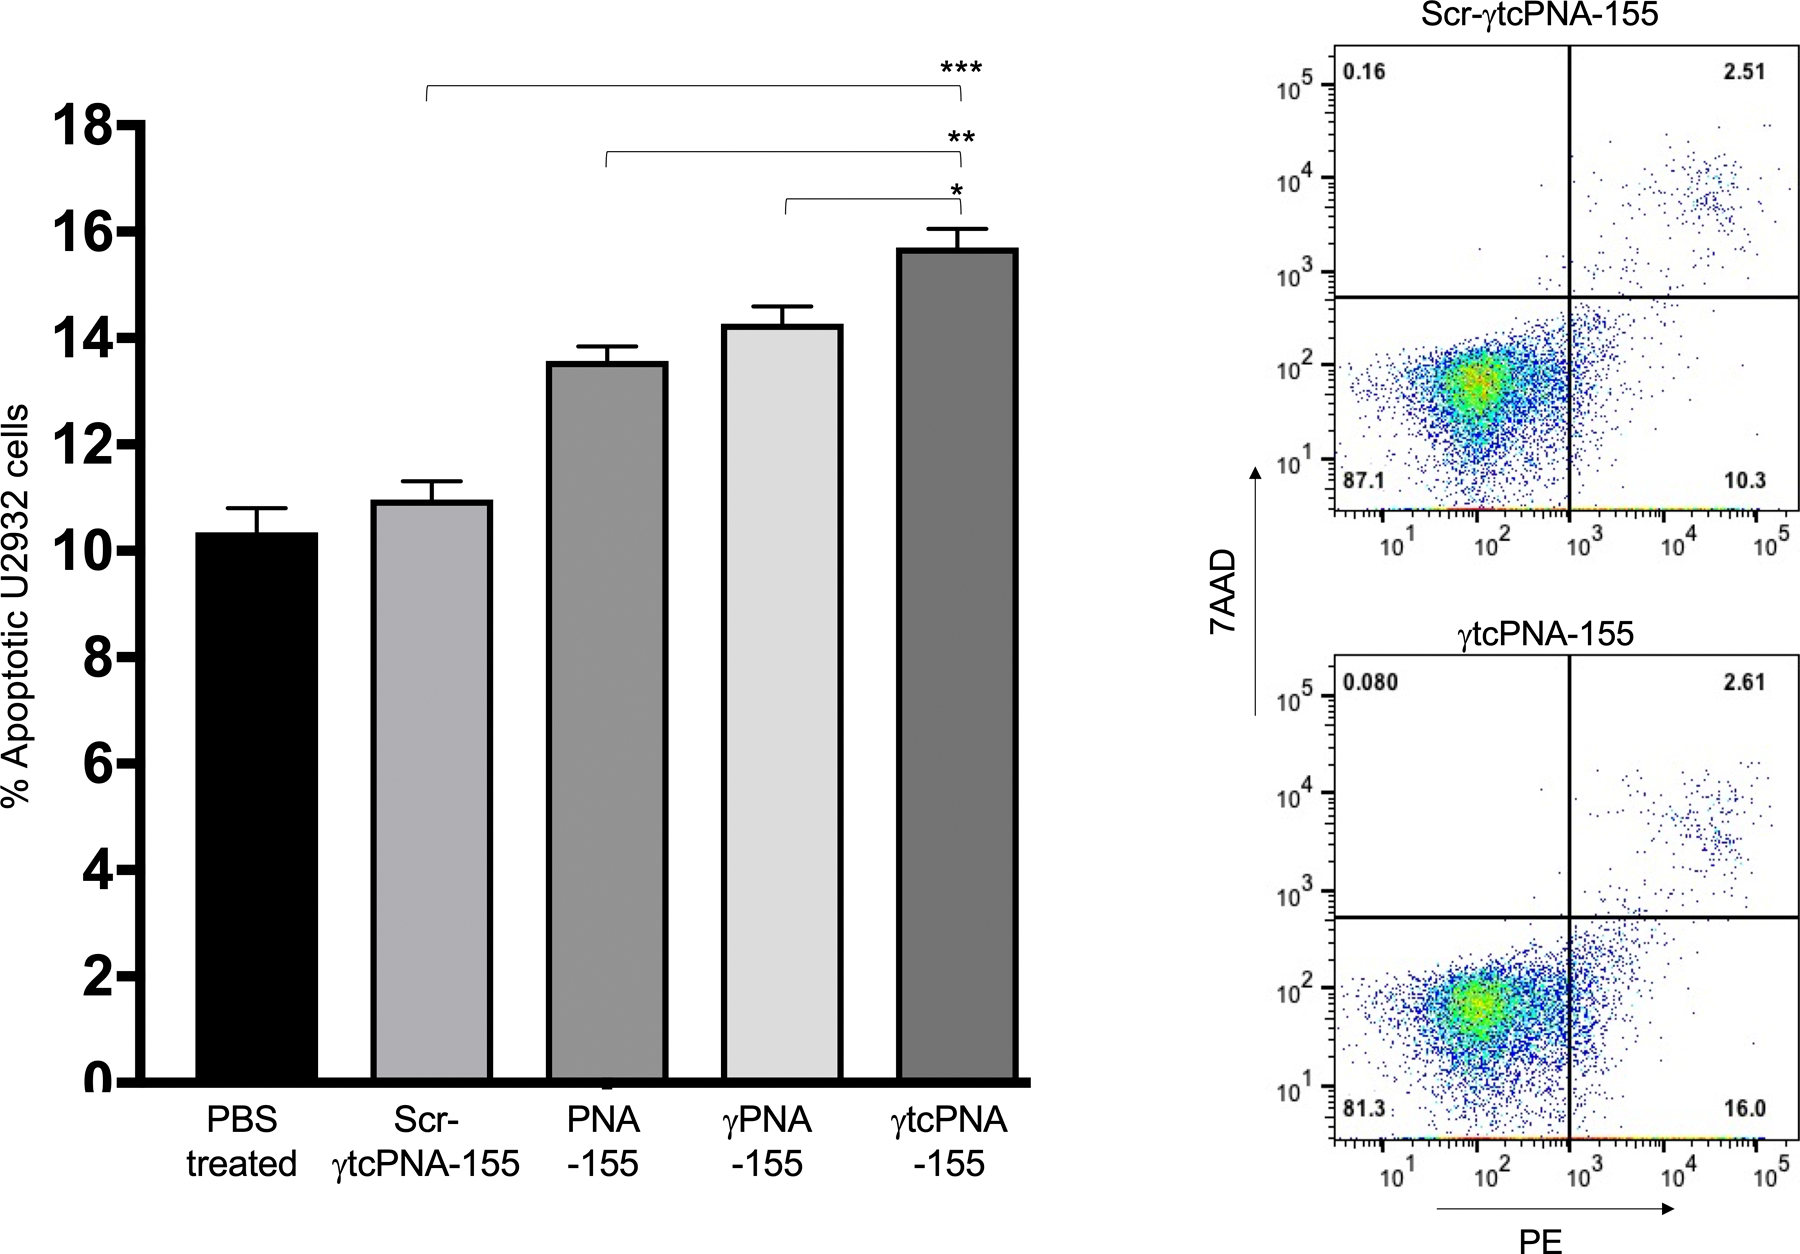
Figure 4. Quantification of apoptosis by Annexin-based assay.

Quantification of apoptotic cells by flow cytometry after treating U2932 cells with PBS as a control and 500nM Scr-γtcPNA-155, PNA-155, γPNA-155 and γtcPNA-155 for 48 hours. The apoptotic cells and necrotic were stained using Phycoerythrin (PE) Annexin V and 7-Amino-Actinomycin (7-AAD) respectively. The % apoptotic cells after treatment was compared to the PBS treated cells, by setting the same threshold. Bar graph of % apoptotic cells (n=3 technical triplicate), data represented as mean ± standard error mean (SEM), *p<0.05, **p<0.01, ***p<0.001, unpaired two-tailed t-test was used for statistical analysis. Representative dot plots of Scr-γtcPNA-155 and γtcPNA-155 treated U2932 cells. The experiment was repeated three times and in triplicate. One out of three representative experiments are shown.
