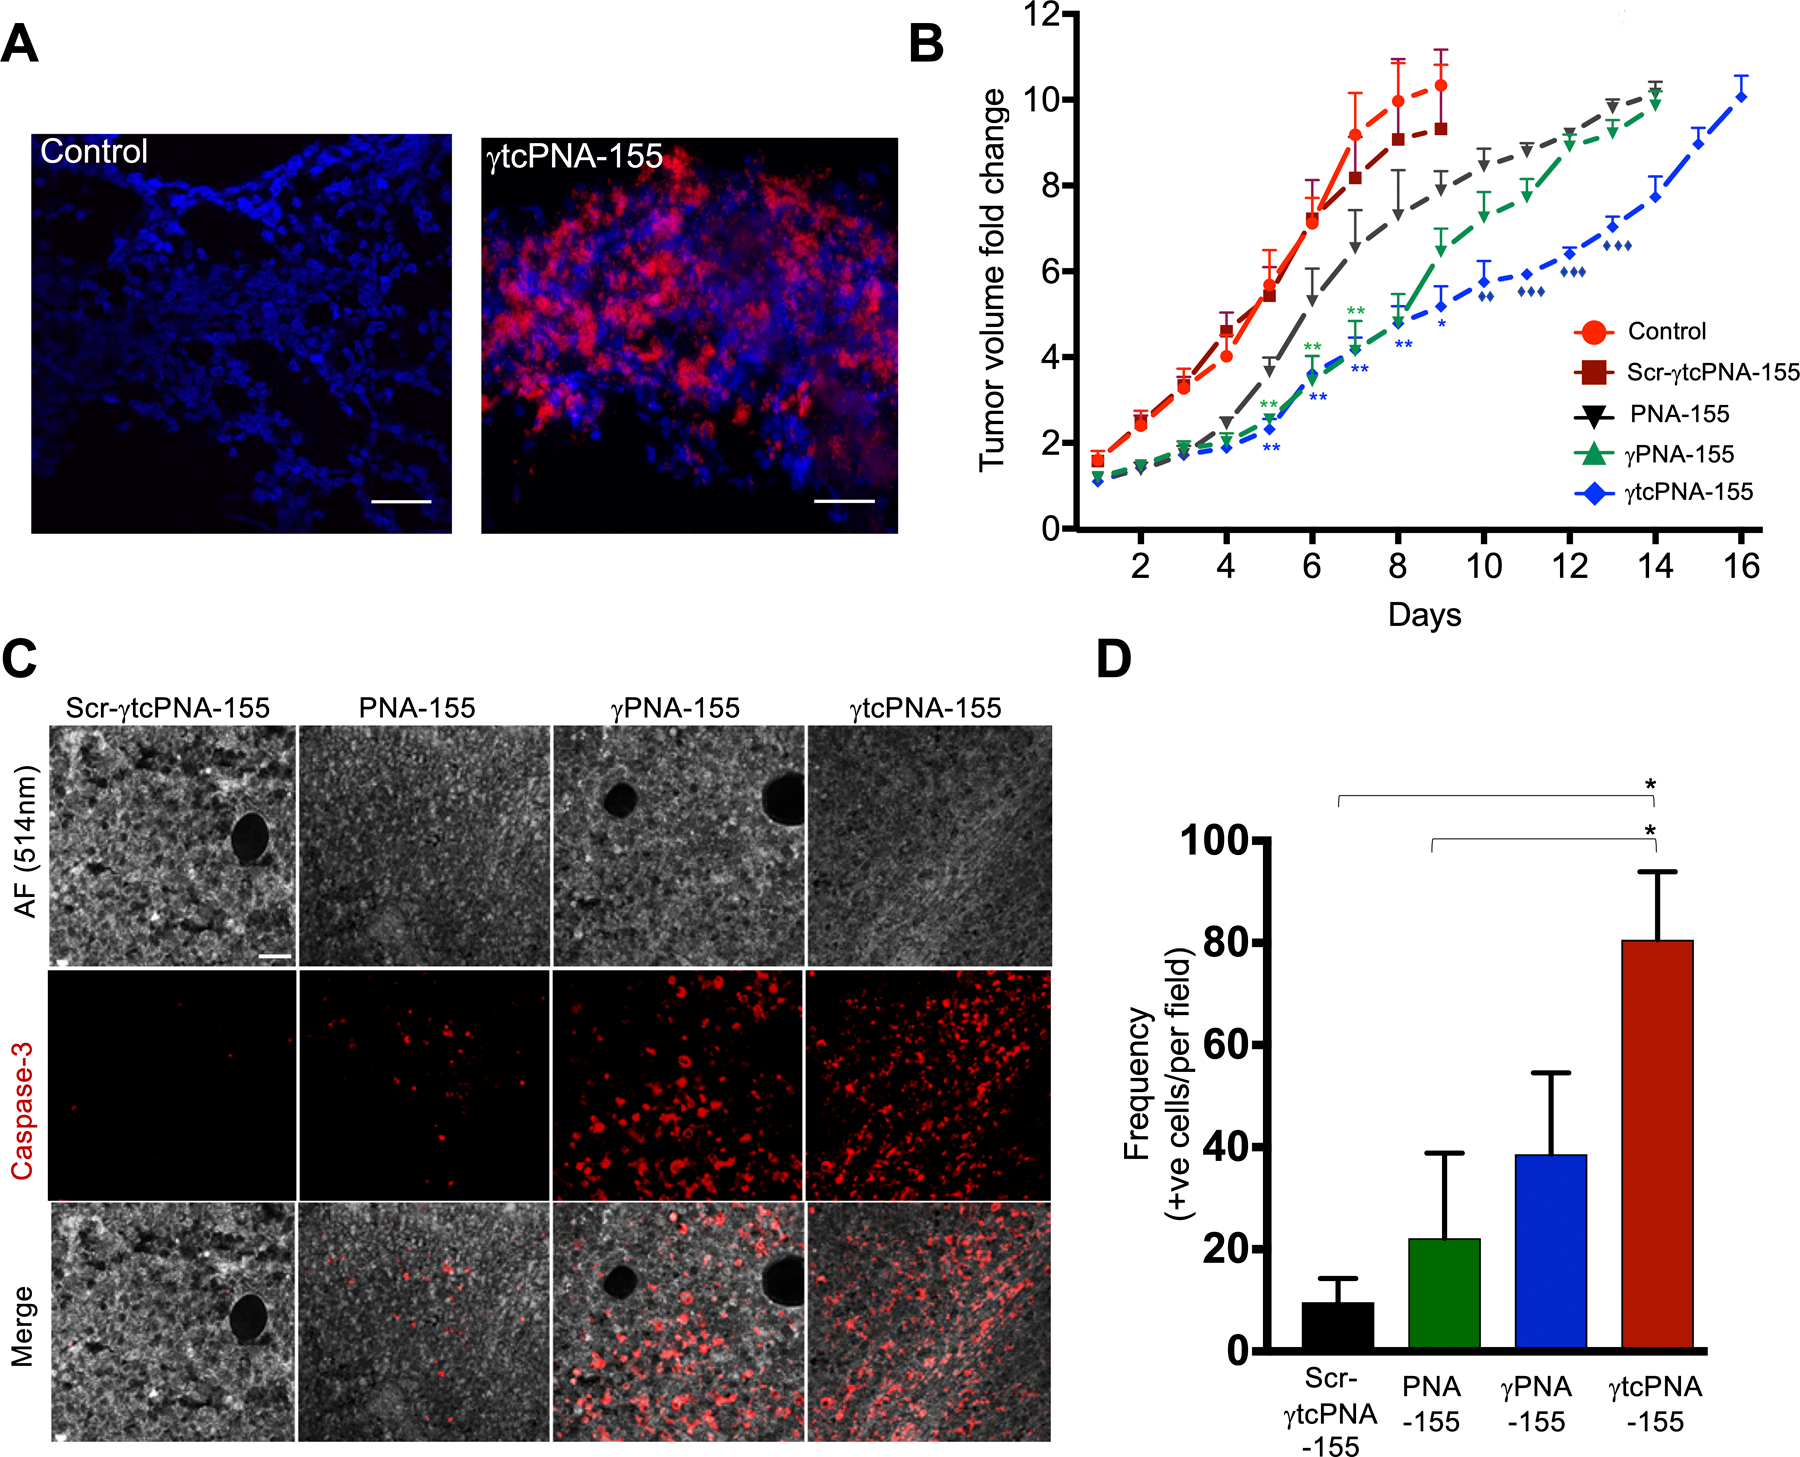
Figure 5. In vivo studies in U2932 derived xenograft model.

(A) Biodistribution of γtcPNA-155 TAMRA in tumor sections (B) Tumor volume fold change (n=6, data represented as mean ± standard error mean (SEM), *p<0.05, **p<0.01, multiple t-tests one per row was used for statistical analysis). Asterisk denotes the analysis was performed relative to Scr-γtcPNA-155. Diamond symbol denotes the analysis was performed relative to PNA-155. (C) Representative images showing the effects of Scr-γtcPNA-155, PNA-155, γPNA-155 and γtcPNA-155 on Caspase-3 immunostaining of tumor (magnification; ×20). Autofluorescence (AF) at 514 nm was used to show the tumor. Scale bar = 50μm. (D) Caspase-3 immunostaining quantification, *p<0.05. n=15. The n indicates the number of images.
