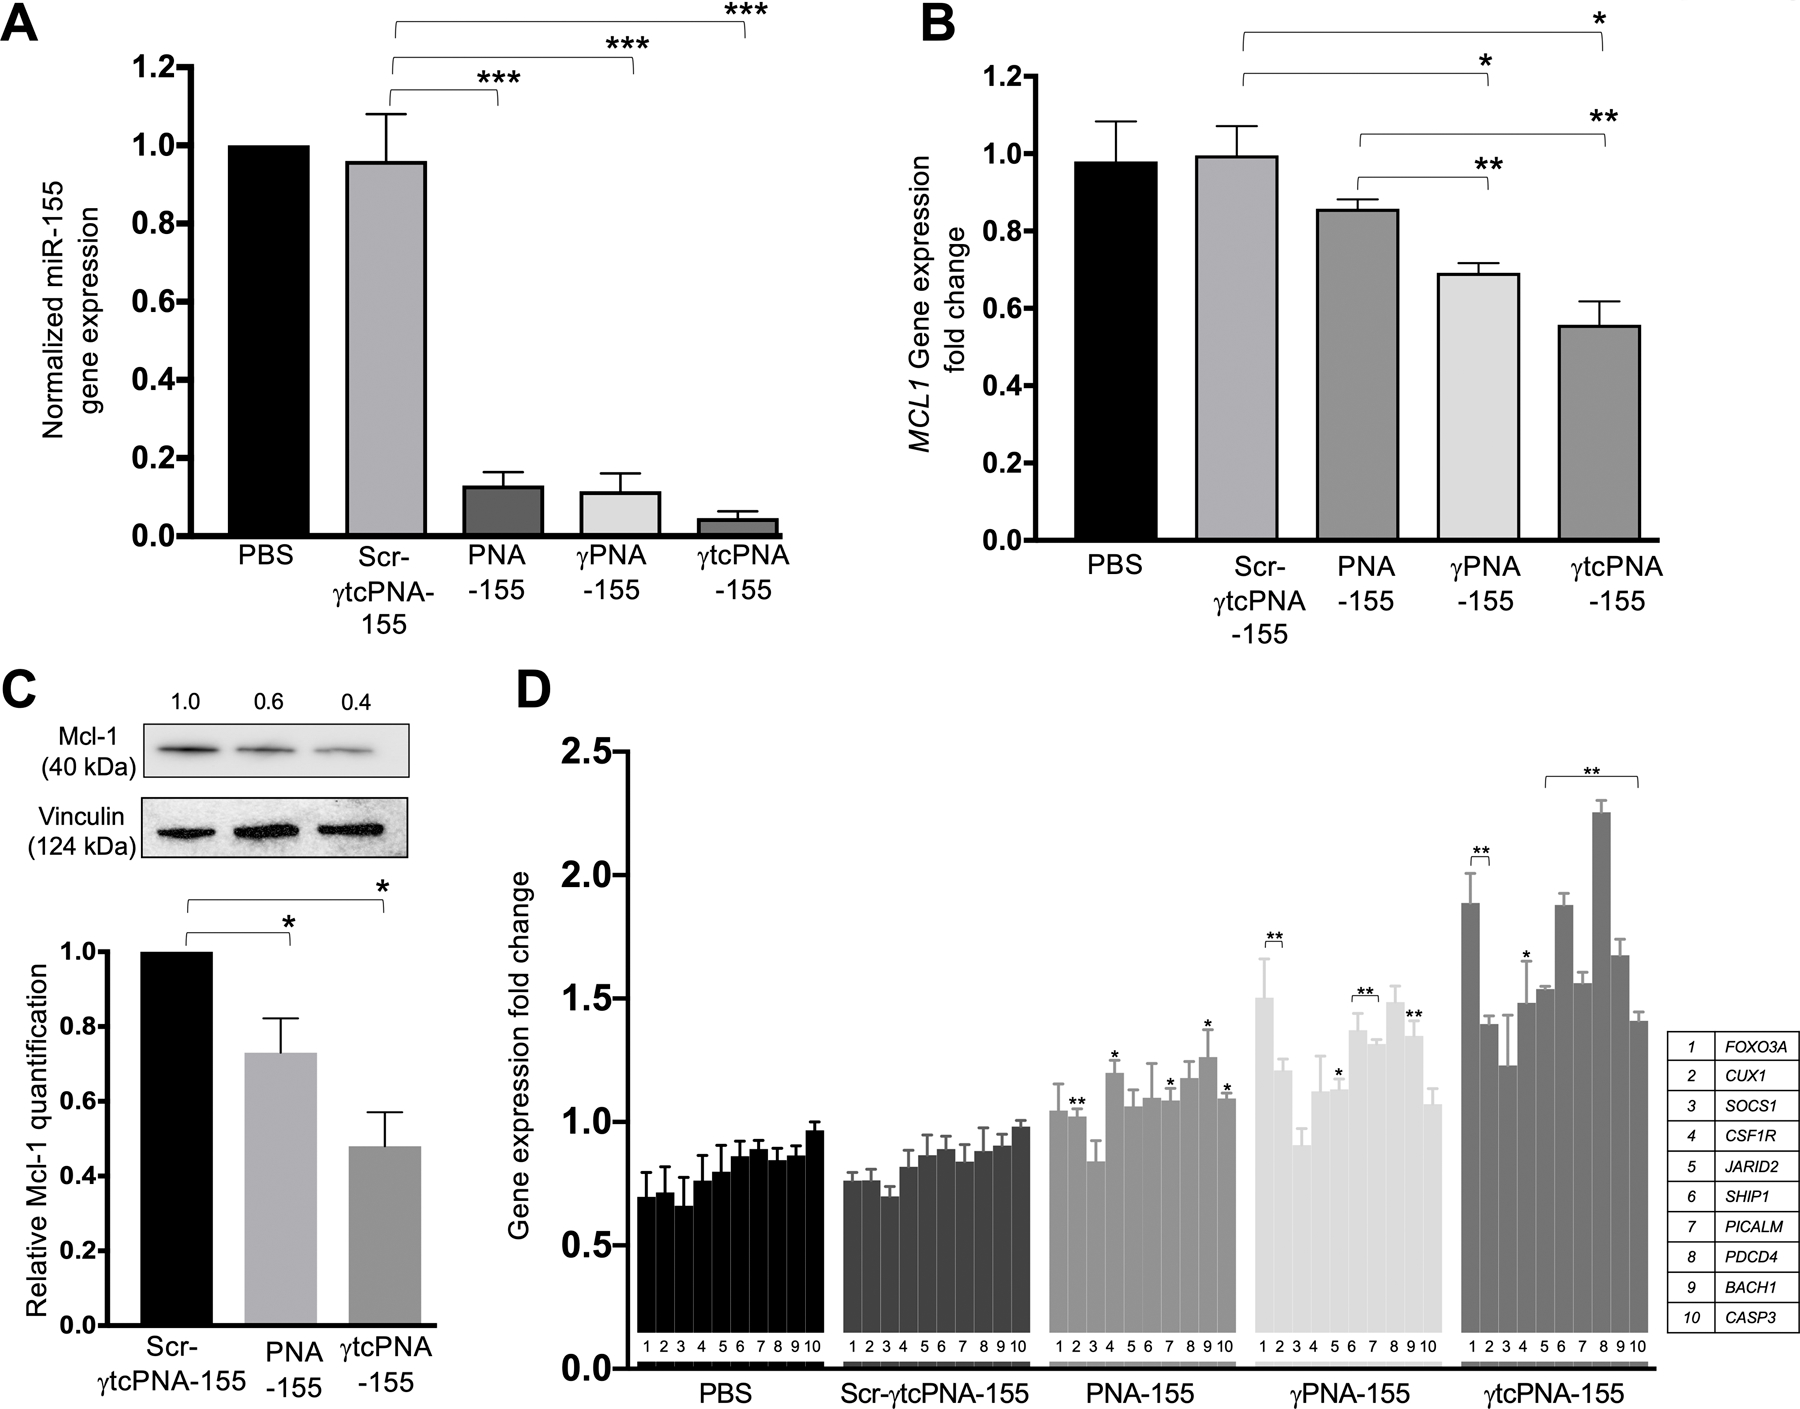
Figure 6. In vivo gene expression and protein level analysis.

(A) miR-155 gene expression levels in U2932 tumor samples after in vivo treatment with indicated PNAs. Data was normalized with average control U6 (n=4, data represented as mean ± standard error mean). ***p<0.001 (B) Gene expression level of downstream target genes of miR-155: MCL1 in U2932 tumor samples after treatment with total 3mg kg-1 dose of Scr-γtcPNA-155, PNA-155, γPNA-155 and γtcPNA-155 and normalized with average control GAPDH (n=3, data represented as mean ± SEM), unpaired two-tailed t-test was performed for analysis). *p<0.05, **p<0.01(C) Representative western blot of Mcl-1protein and its quantification (n=3 technical replicate) in U2932 tumor samples treated with total 3mg kg-1 dose of Scr-γtcPNA-155, PNA-155 and γtcPNA-155. Data is represented as mean ± SEM and unpaired two-tailed t-test was performed for analysis. * p <0.05. The relative protein levels were determined from the band intensity using ImageJ software, and normalized relative to loading control and treatment control. (D) Gene expression level of tumor suppressor proteins (FOXO3A, CUX1, SOCS1, CSF1R, JARID2, SHIP1, PICALM, PDCD4, BACH1, CASP3) in U2932 tumor samples after treatment with total 3mg kg-1 dose of Scr-γtcPNA-155, PNA-155, γPNA-155 and γtcPNA-155 and normalized with average control GAPDH (n=3, data represented as mean ± SEM, unpaired two-tailed t-test was performed for statistical analysis). *p<0.05, **p<0.01.
