Figure 5.
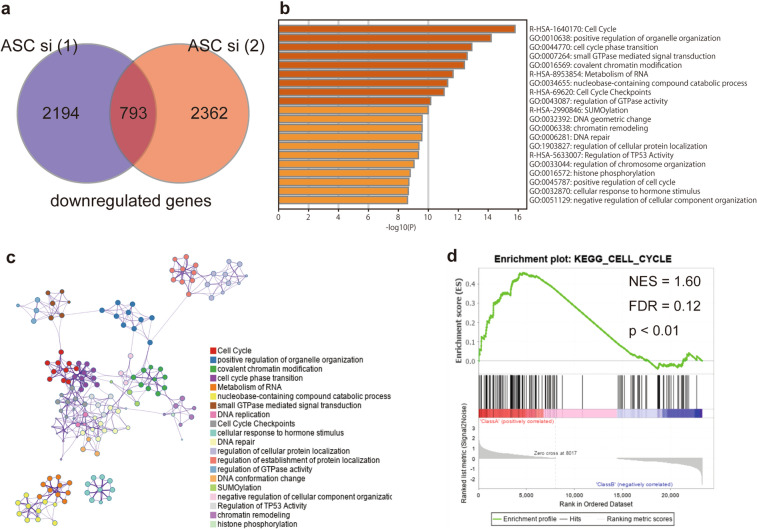
Functional enrichment analysis using Metascape and GSEA. (a) Venn diagram showing overlapping RNAs detected via RNA-seq analysis of downregulated RNAs at 72-h post-transfection of either ASC (1) or (2) siRNA and relative to control siRNA-transfected PANC-1 cells. (b) Functional enrichment results. Heatmap showing the top 20 clusters colored according to the p-value (darker color indicates a lower p-value). (c) Network of the top 20 clusters of enriched terms. Each node indicates an enrichment term colored by cluster ID. Nodes sharing the same cluster are generally located in close proximity. Terms with a kappa similarity ≥ 0.3 are connected. (d) GSEA for the gene signature of KEGG_CELL_CYCLE. NES normalized enrichment score, FDR false discovery rate.

