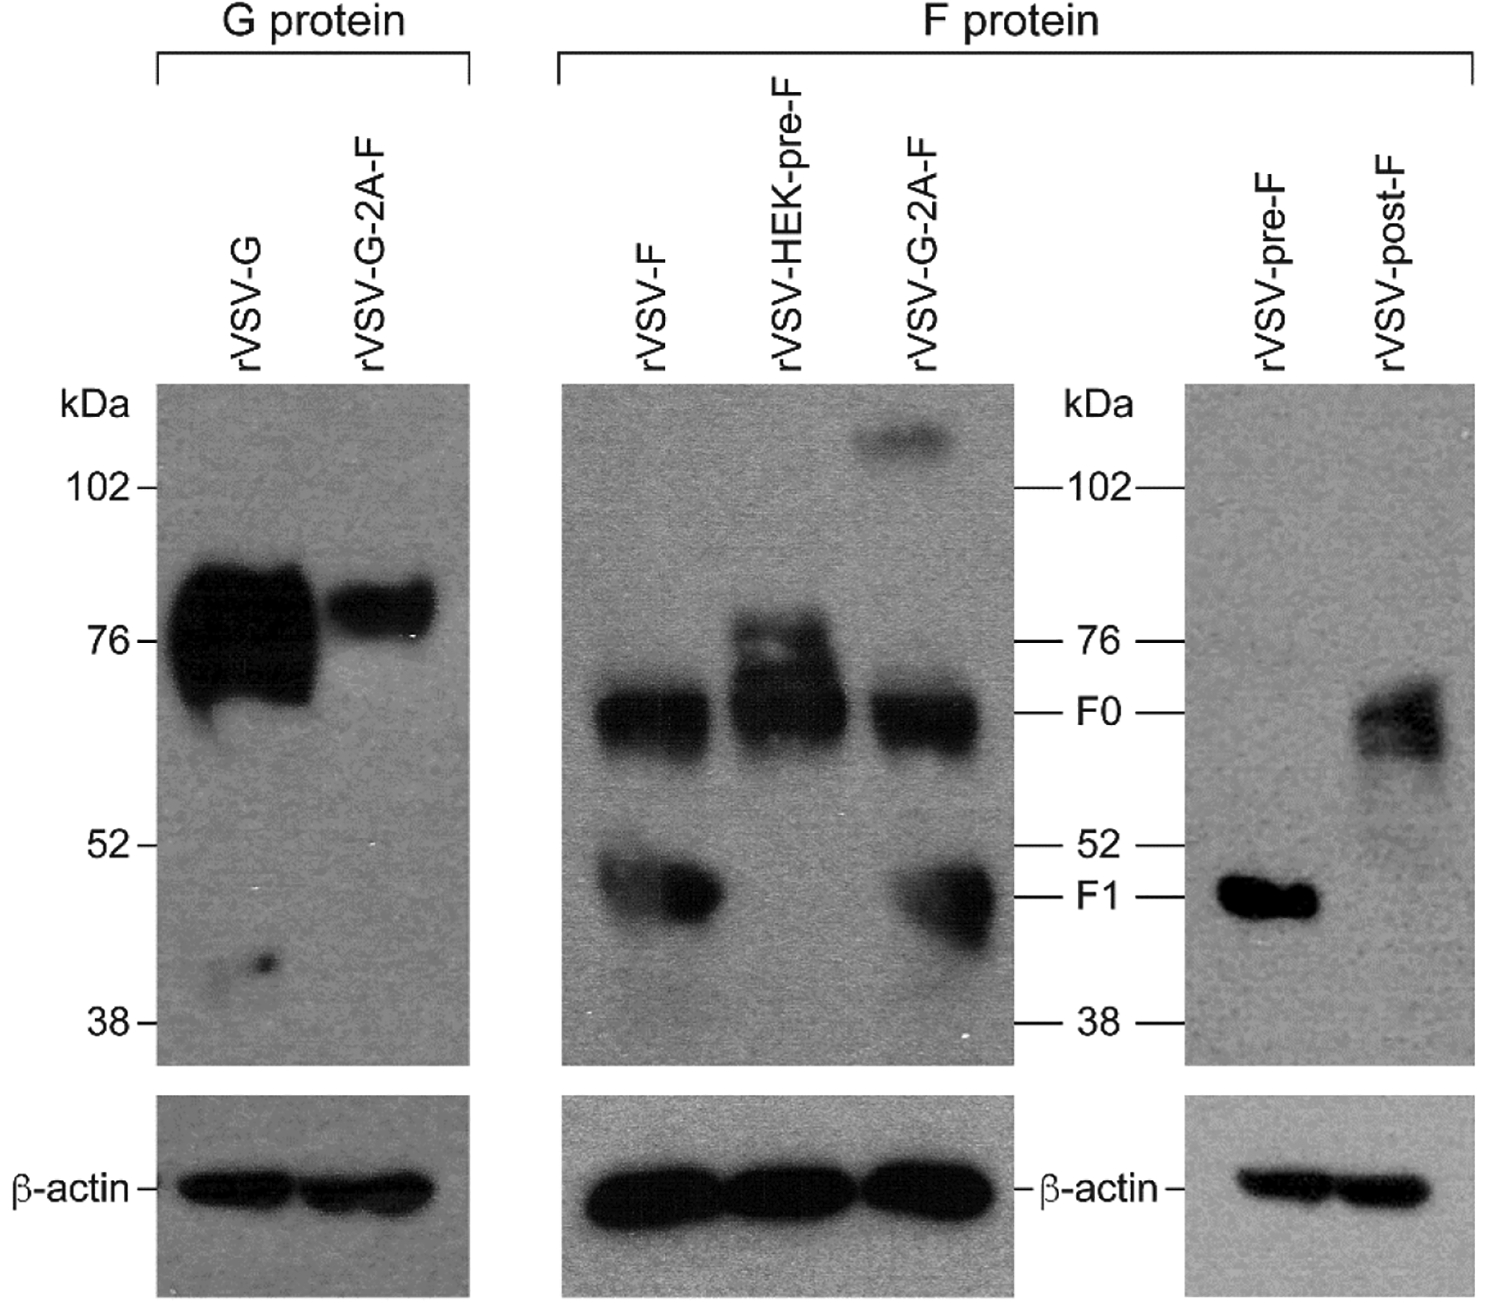
Figure 2. Protein expression of RSV-G or RSV-F proteins in BHK21 cells infected with rVSV-F, rVSV-post-F, rVSV-HEK-pre-F, rVSV-G-2A-F, or rVSV-G.

BHK21 cells were infected for 12 hours with an MOI of 4, and protein expression level of G (left panel) or F (middle and right panels) was assessed via Western blotting under dissociating (reducing) conditions. A representative blot of the control protein beta-actin is also shown. Left panel: 25 ug total protein cell lysates of rVSV-G or rVSV-G-2A-F infected cells was loaded and analyzed using a goat anti-RSV primary antibody with a chicken anti-goat + HRP secondary antibody. Bands representing the G protein can be seen at approximately 72–85 kDa.
Middle panel: 25 ug total protein of cell lysates of rVSV-F, rVSV-HEK-pre-F or rVSV-G-2A-F infected cells was loaded and analyzed using an F specific antibody (Motavizumab) and a secondary donkey anti-human + HRP antibody. All three constructs have a band at approximately 67 kDa representing F0, and the unstabilized F proteins (F and G-2A-F) also have bands at approximately 50 kDa, representing the F1 subunit. The high molecular weight band in G-2A-F likely represents an oligomer of the F protein that did not dissociate.
Right panel: 25 ug total protein of cell lysates of rVSV-pre-F or rVSV-post-F was loaded and analyzed using a primary F specific antibody (Motavizumab) and a donkey anti-human + HRP secondary antibody. There is a band representing the F1 subunit in pre-F, and a band representing F0 in post-F.
