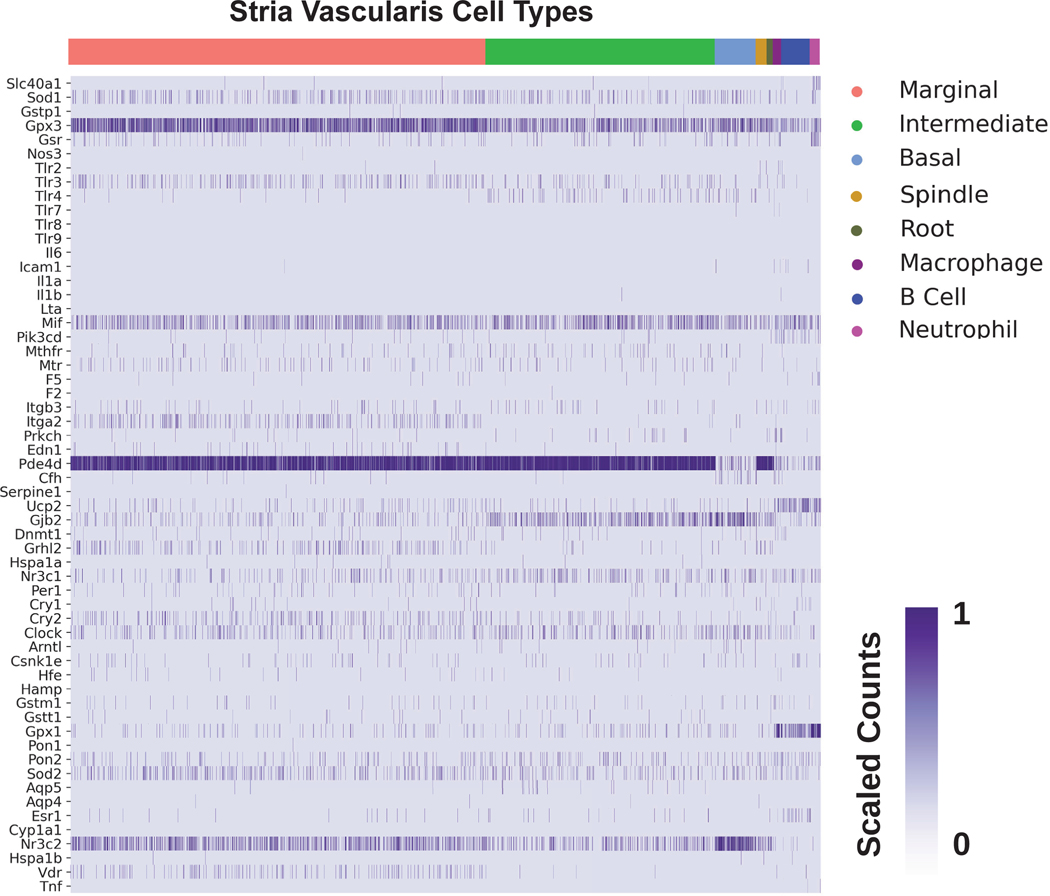
Figure 3B. Expression of SSNHL-investigated genes in the adult mouse stria vascularis utilizing a single nucleus RNA-Seq adult mouse stria vascularis dataset (Korrapati, Taukulis et al., 2019).

Heatmap displays cells along the horizontal axis with cell types grouped by color and SSNHL-investigated genes along the vertical axis. The darker the bar the more highly expressed the gene is in a given cell. Cell types include SV cell types (marginal cells in pink, intermediate cells in green, basal cells in light blue), cells at the boundary of the SV (spindle cells in gold, root cells in dark green, fibrocytes in light green), as well as immune cells (macrophages in purple, B cells in blue, and neutrophils in magenta).
