
FIGURE 2.
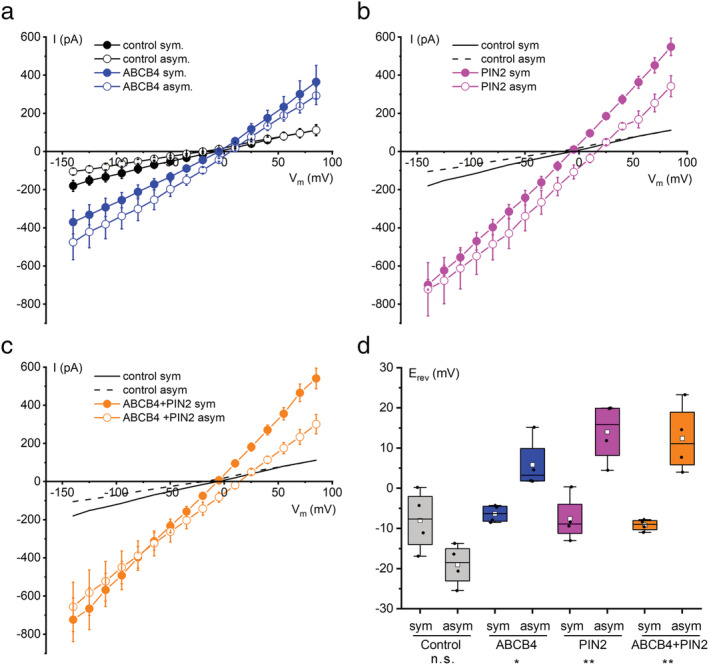
Current–voltage analysis of ABCB4, PIN2, and co‐expressed ABCB4 + PIN2 in symmetrical and asymmetrical conditions demonstrates anion preference. (a) ABCB4 and control cell I–V relationships recorded with 140 mM CsCl in the bath and pipette (symmetrical) and after switching the bath to 14 mM CsCl (asymmetrical). Plotted are the mean currents ± SE at each voltage obtained from four separate cells for each condition. (b) Same as (a) but for cells expressing PIN2. The control cell curves are re‐plotted from (a). (c) Same as (b) but for cells co‐expressing ABCB4 and PIN2. (d) The reversal potential (E rev ) values determined by linear regression performed on a limited portion of the I–V curve and displayed in a box plot. The positive shift in mean E rev (white square symbol within box) between symmetric and asymmetric conditions was used to calculate Cl− to Cs+ permeability ratios (PCl:PCs) with Equation 1 for ABCB4 (1.91), PIN2 (2.95), and ABCB4 + PIN2 (2.95). Notations on the bottom of the graph indicate whether the differences in E rev between the symmetrical and asymmetrical CsCl were not statistically significant (n.s.) or significant with *p < 0.05 or **p < 0.01