
FIGURE 3.
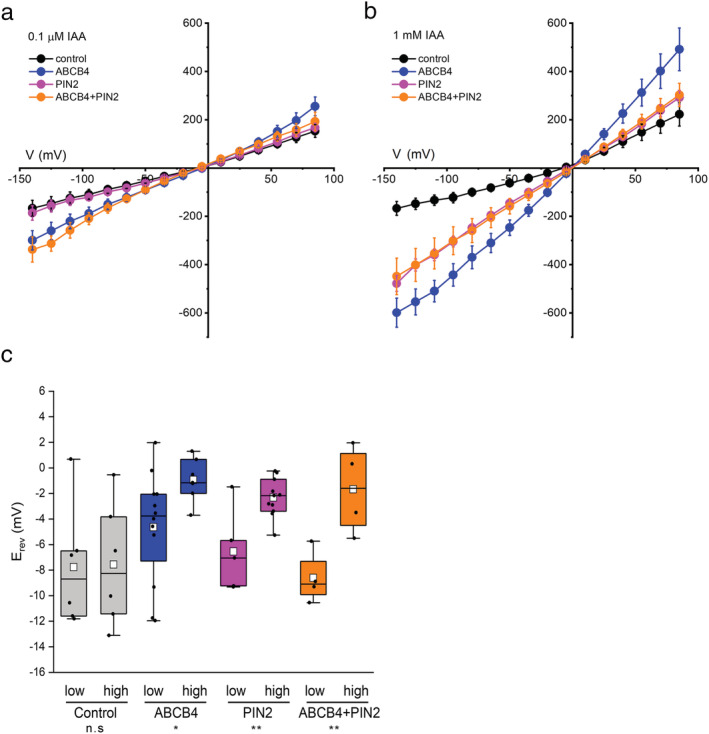
IAA− permeability demonstrated by current–voltage analysis. (a) I–V curves obtained in symmetrical 50 mM CsCl conditions with 0.1 μM IAA in the pipette, that is, on the cytoplasmic side. (b) I–V curves obtained as in (a) but with 1 mM IAA in the pipette. The number of independent cells measured per condition was between 4 and 14. (c) Reversal potentials (E rev ) of I–V curves obtained with either 0.1 μM IAA (low) or 1 mM IAA (high) in the pipette displayed in box plots with the means denoted by white square symbols. The E rev value for each trial (independent cell) was determined by linear regression performed on a limited portion of the I–V curve. Notations on the bottom of the graph indicate whether the differences in E rev between the low and high auxin concentrations were not statistically significant (n.s.), or significant with *p < 0.05 or **p < 0.01