
Figure 1,
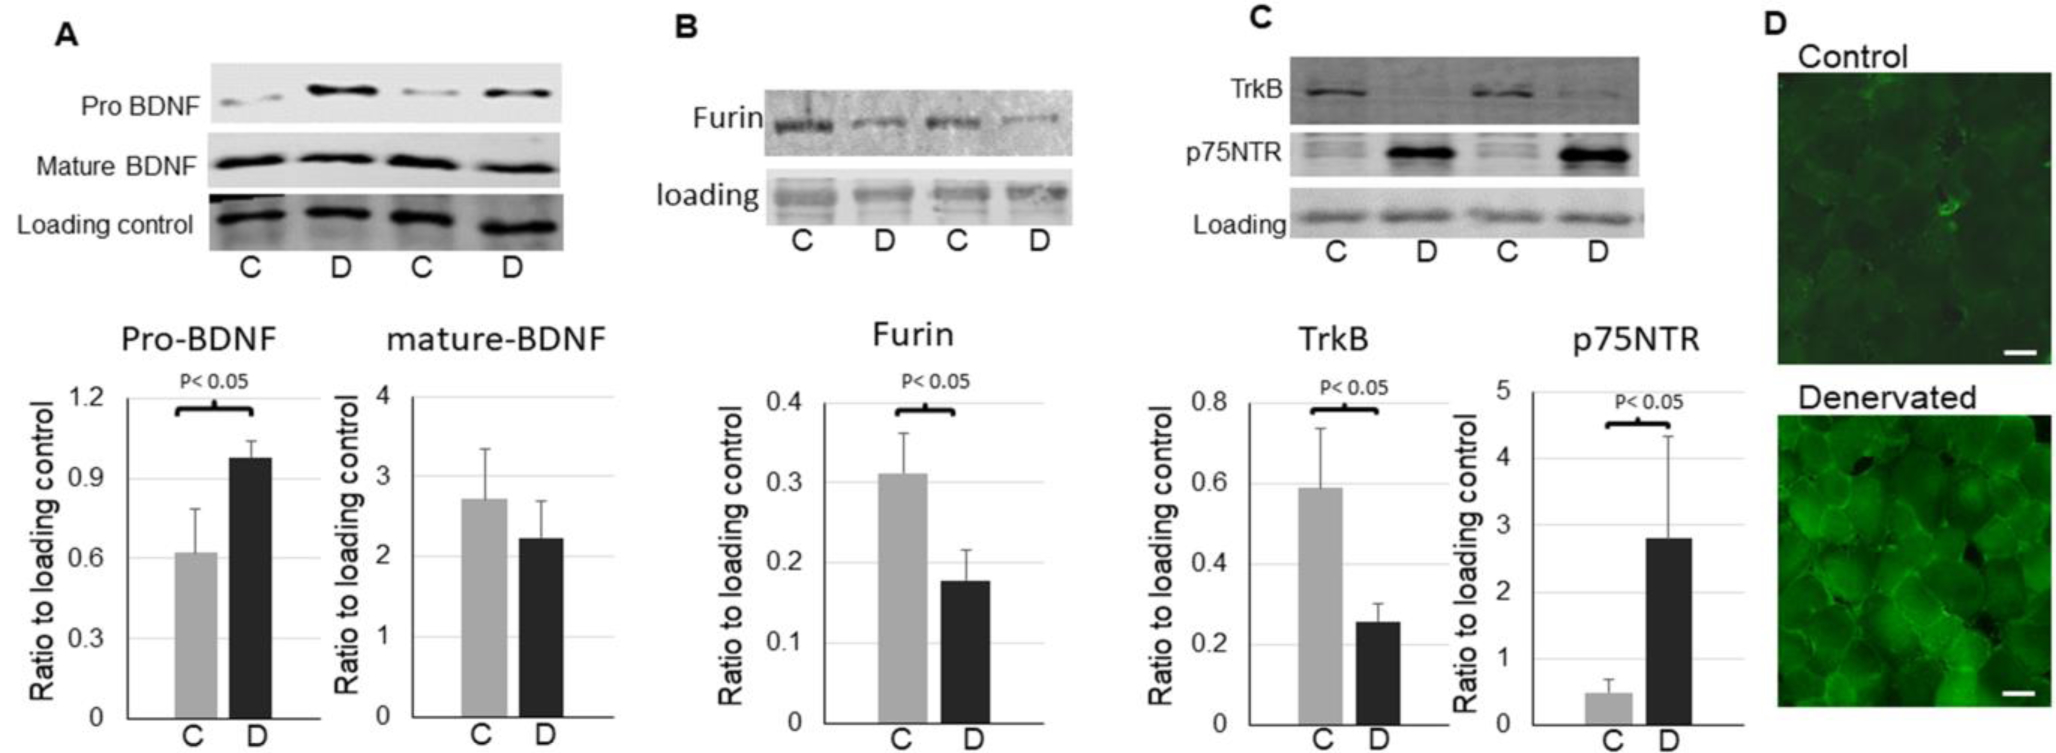
Upregulation of pro-BDNF and p75NTR in denervated skeletal muscle. A: representative images and quantifications of pro-BDNF and mature BDNF in the control and denervated muscle (n=6). B: representative images and quantifications of furin in the control and denervated muscle (n=5). C: representative images and quantifications of TrkB and p75NTR in the control and denervated muscle (n=6). D: Immunofluorescent staining for p75NTR in the control and denervated muscle (scale bar = 20 μm, 20x objective). The label “C”=control, “D”=denervated. Data is represented as means ± S.D. analyzed by student’s t-tests.