
Figure 2,
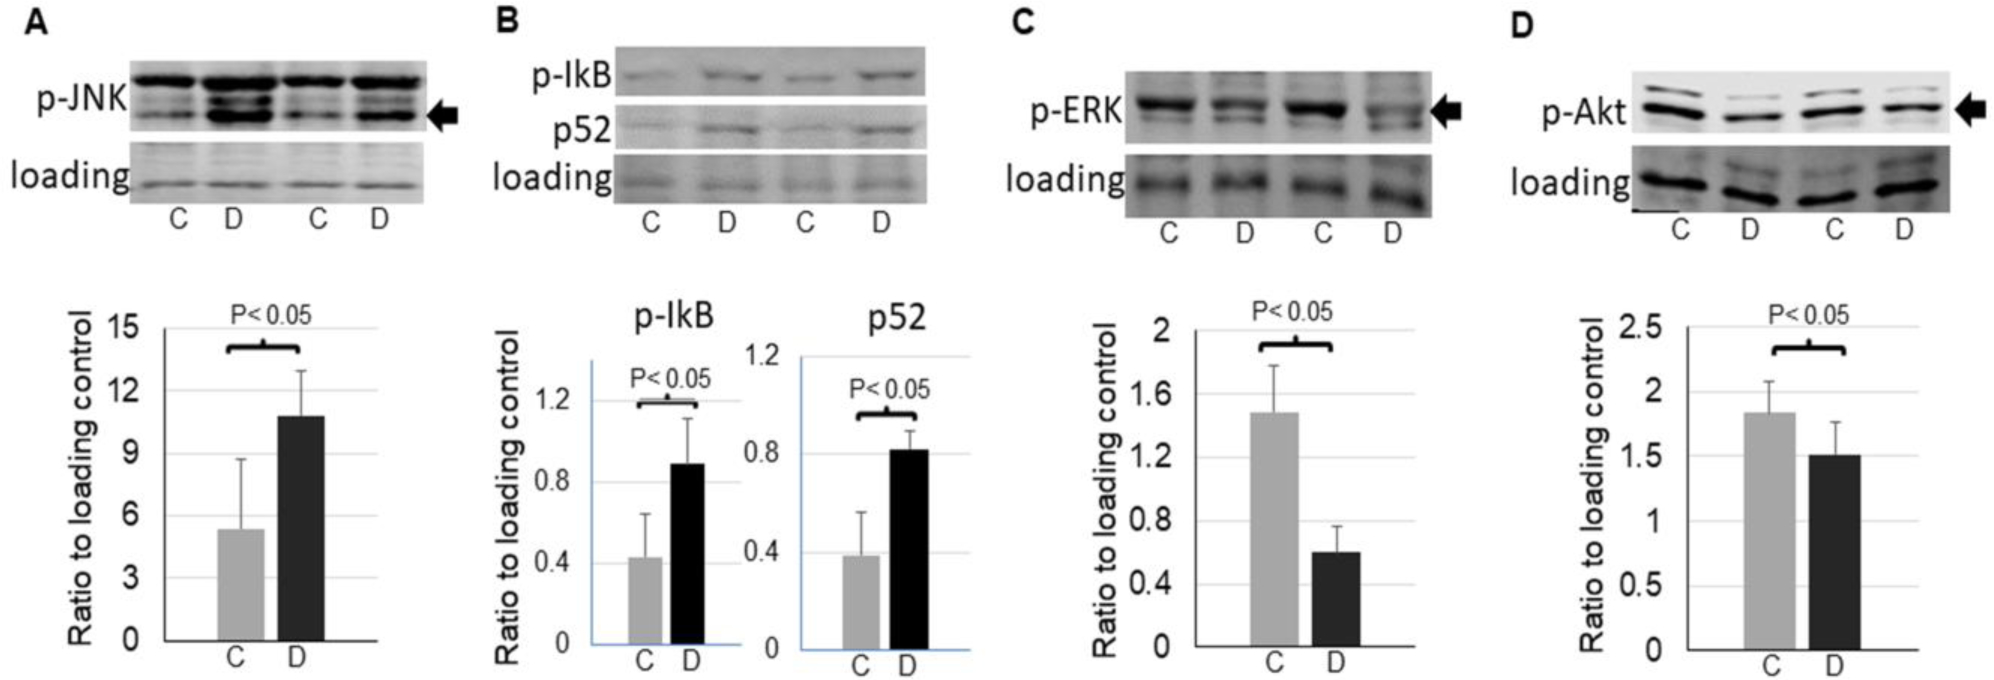
Alterations of signaling pathways in the control and denervated muscle. A: representative images and quantifications of phosphorylation of JNK (54 kDa band, as indicated by an arrow) in the control and denervated muscle (n=5). B: representative images and quantifications of IkB phosphorylation and p52 in the control and denervated muscle (n=5). C: representative images and quantifications of phosphorylation of ERK (44 kDa band as indicated by an arrow) in the control and denervated muscle (n=5). D: representative images of quantifications of phosphorylation of Akt (60 kDa as indicated by an arrow) in the control and denervated muscle (n=6). Data is represented as means ± S.D. analyzed by student’s t-tests.