Figure 1.
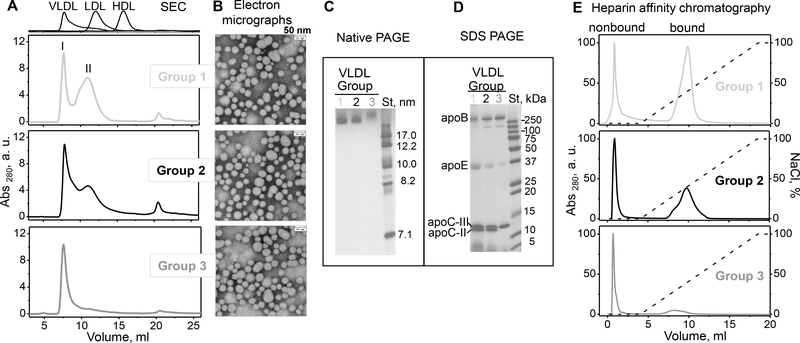
Characterization of single-donor VLDL isolated from plasma of three representative healthy donors from groups 1 (light grey), 2 (black) and 3 (dark grey) (low, medium and high TG). Table 1 shows biochemical composition of these VLDL.
(A) SEC profiles and (B) transmission electron micrographs of VLDL groups 1 to 3 (top to bottom). Peaks I and II, which correspond to VLDL subclasses VLDL1 (large buoyant) and VLDL2 (small dense), are indicated (see supplemental Figure S4 for details). Elution profiles of freshly isolated single-donor human HDL, LDL and VLDL are shown for reference (top).
(C) Non-denaturing PAGE and (D) SDS PAGE of VLDL groups 1 to 3 (left to right). St – molecular standards. Bands corresponding to the major VLDL apolipoproteins are labeled in panel D.
(E) Heparin-sepharose chromatography profiles of VLDL. Bound and non-bound fractions are labeled. The dotted line indicates the calculated NaCl concentration (100% corresponds to 1.01 M NaCl).

