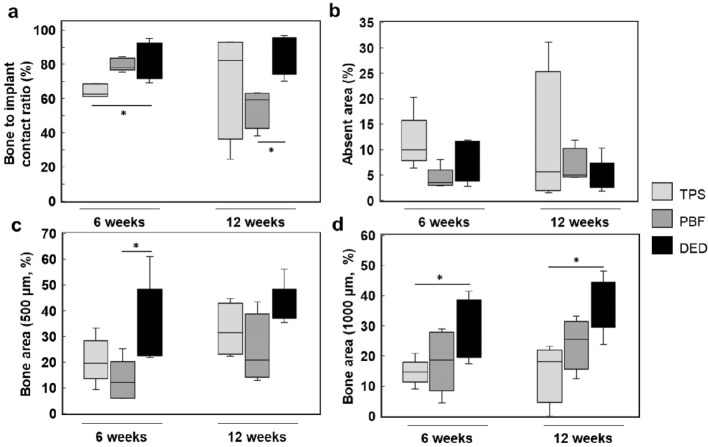
Figure 5.
Results of bone histomorphometry. (a) Bone-to-implant contact (BIC); the DED group showed significantly higher BIC than the other groups 6 weeks after implantation, and higher BIC than the PBF group at 12 weeks. (b) Absent area; there was no significant difference across the three test groups at 6 and 12 weeks. (c) 500 µm bone area; the DED group showed higher osseointegration than the PBF group in 500-µm bone area at 6 weeks. (d) 1000 µm bone area; the DED group showed higher osseointegration than the TPS group at 6 and 12 weeks (*p < 0.05).

