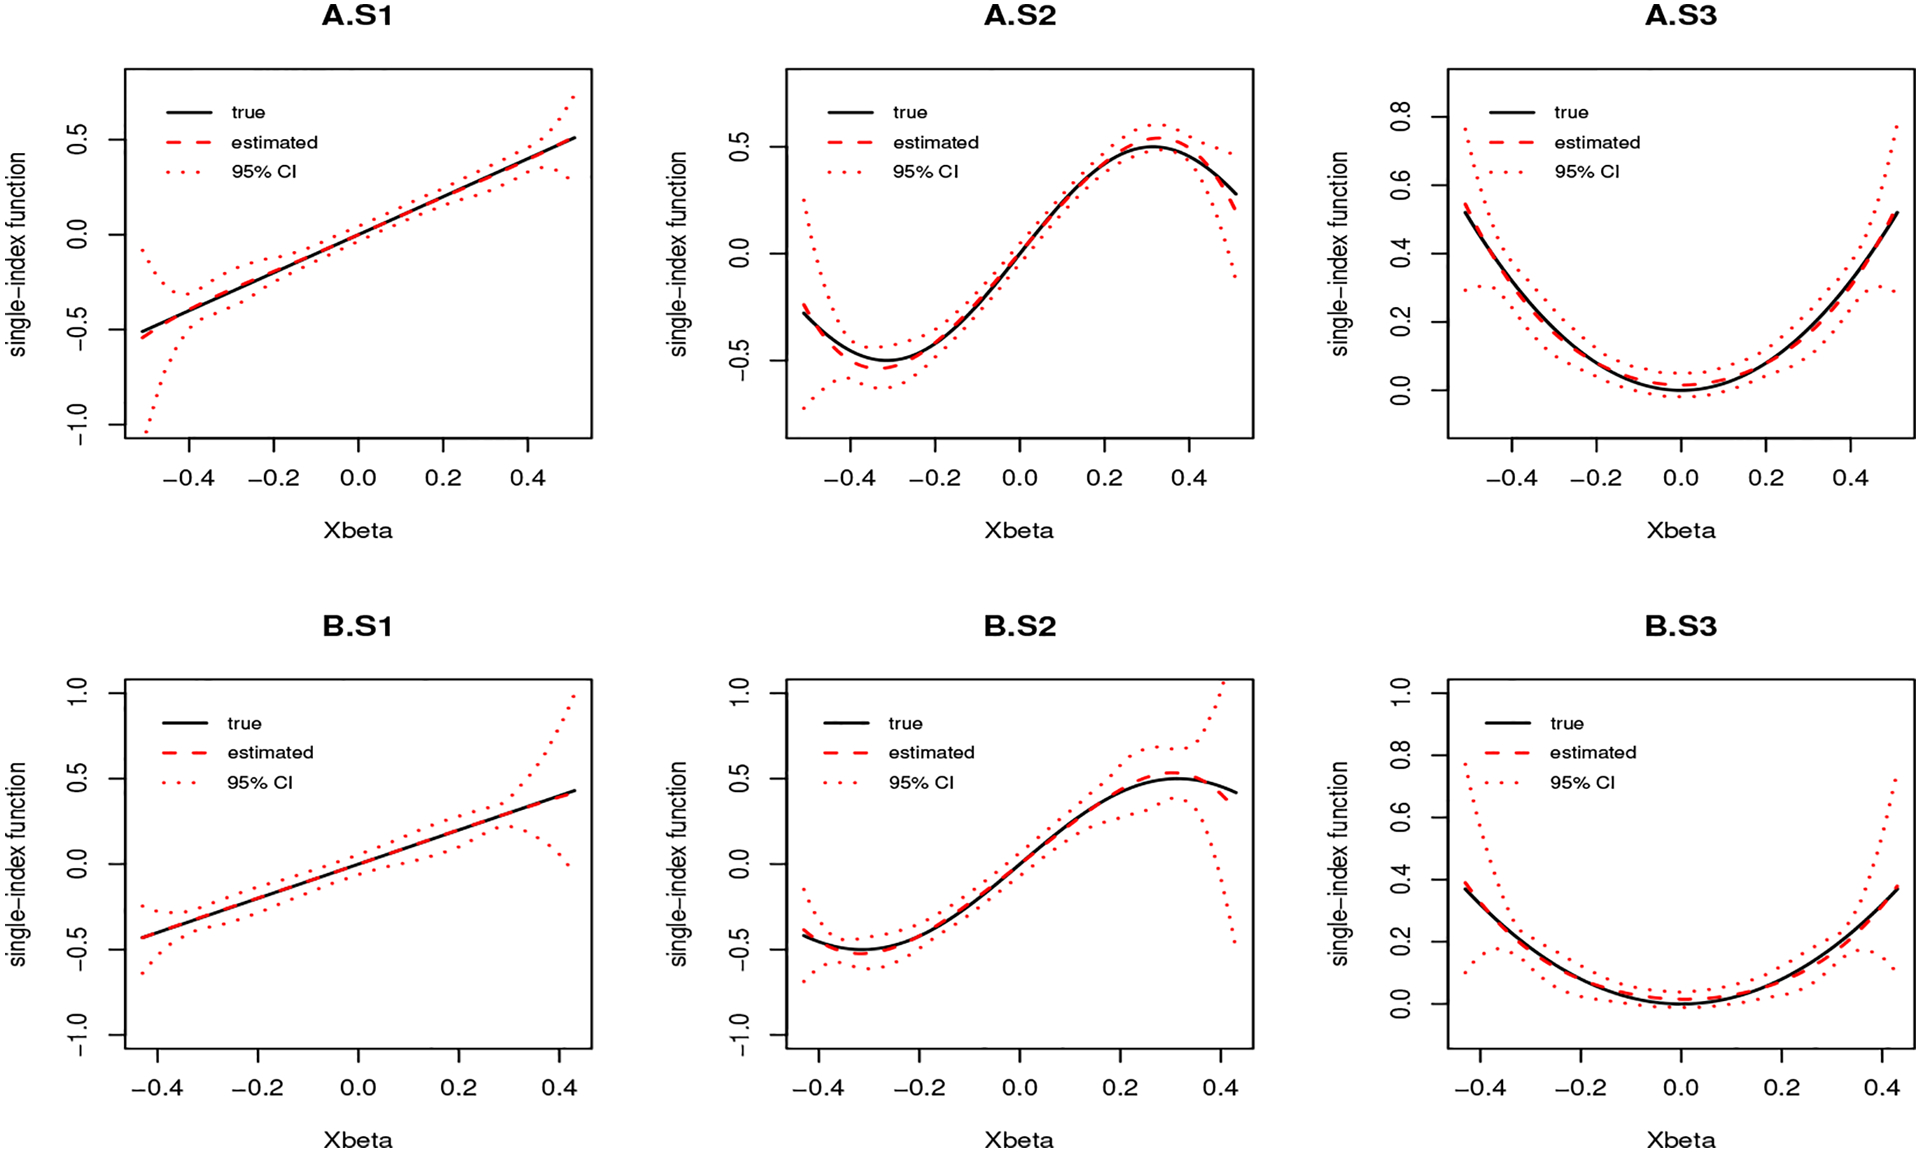
FIGURE 1.

The mean of estimated single-index function with 95% confidence intervals when (A) g(t) = exp(t) and (B) g(t) = t with sample size 4000 and censoring rate 10%: (S1) linear single-index function; (S2) sine curve single-index function; (S3) quadratic single-index function.
