. 2021 Sep 20;27(22):6209–6221. doi: 10.1158/1078-0432.CCR-21-0361

Figure 5.

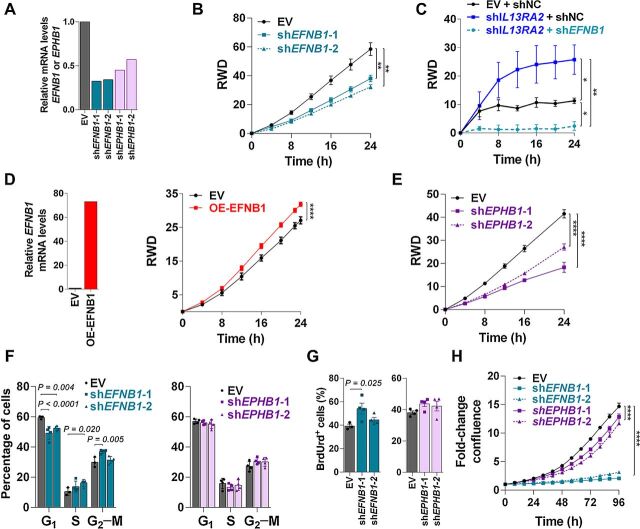
Figure 5. Downregulation of EFNB1 impairs invasion and promotes DNA synthesis. A, 231BR cells expressing EV or shRNAs targeting EFNB1 (shEFNB1–1/2) or EPHB1 (shEPHB1–1/2) were cultured for 48 hours. EFNB1 and EPHB1 mRNA levels were detected by RT-qPCR, normalized to GAPDH, and reported as relative to EV. B, 231BR cells expressing EV and shEFNB1–1/2 were plated in a confluent monolayer and serum starved overnight, and a modified Matrigel-filled scratch wound was used to assess invasion. Graph shows relative wound density (RWD) over time (n = 6–10 wells per group). Data analyzed with repeated measures ANOVA followed by multiple comparison post hoc corrections. **, P < 0.01; ****, P < 0.001 at the last time point. C, 231BR cells expressing EV or shIL13RA2 were transduced with shNC or shEFNB1 as indicated, and induced with doxycycline for 72 hours before plating. Invasion was measured as in B. *, P < 0.05; **, P < 0.01. D, 231BR cells were transfected with a lentiviral empty vector (EV) or overexpressing EFNB1 gene (OE-EFNB1). Left, Graph shows EFNB1 mRNA levels normalized to GAPDH and relative to EV cells. Right, Graphs show invasion of 231-EV and OE-EFNB1 analyzed as in B. ****, P < 0.001 at the last time point. E, 231BR cells expressing EV or shEPHB1–1/2 were plated and analyzed for invasion as in B. F, 231BR cells expressing EV and shEFNB1–1/2 or shEPHB1–1/2 were plated for 48 hours, treated with BrdUrd, 1 hour stained with PI for cell-cycle analysis. Graph shows cell-cycle analysis by flow cytometry (n = 4). Adjusted P values are shown. G, BrdUrd incorporation measured in cells from F. H, 231BR cells expressing EV and shEFNB1–1/2 or shEPHB1–1/2 were plated, and percentage of confluence was measured over time using Incucyte live imaging (n = 5 wells per treatment). Data analyzed with repeated measures ANOVA followed by multiple comparison post hoc corrections. ****, P < 0.001 at the last time point.

Downregulation of EFNB1 impairs invasion and promotes DNA synthesis. A, 231BR cells expressing EV or shRNAs targeting EFNB1 (shEFNB1–1/2) or EPHB1 (shEPHB1–1/2) were cultured for 48 hours. EFNB1 and EPHB1 mRNA levels were detected by RT-qPCR, normalized to GAPDH, and reported as relative to EV. B, 231BR cells expressing EV and shEFNB1–1/2 were plated in a confluent monolayer and serum starved overnight, and a modified Matrigel-filled scratch wound was used to assess invasion. Graph shows relative wound density (RWD) over time (n = 6–10 wells per group). Data analyzed with repeated measures ANOVA followed by multiple comparison post hoc corrections. **, P < 0.01; ****, P < 0.001 at the last time point. C, 231BR cells expressing EV or shIL13RA2 were transduced with shNC or shEFNB1 as indicated, and induced with doxycycline for 72 hours before plating. Invasion was measured as in B. *, P < 0.05; **, P < 0.01. D, 231BR cells were transfected with a lentiviral empty vector (EV) or overexpressing EFNB1 gene (OE-EFNB1). Left, Graph shows EFNB1 mRNA levels normalized to GAPDH and relative to EV cells. Right, Graphs show invasion of 231-EV and OE-EFNB1 analyzed as in B. ****, P < 0.001 at the last time point. E, 231BR cells expressing EV or shEPHB1–1/2 were plated and analyzed for invasion as in B. F, 231BR cells expressing EV and shEFNB1–1/2 or shEPHB1–1/2 were plated for 48 hours, treated with BrdUrd, 1 hour stained with PI for cell-cycle analysis. Graph shows cell-cycle analysis by flow cytometry (n = 4). Adjusted P values are shown. G, BrdUrd incorporation measured in cells from F. H, 231BR cells expressing EV and shEFNB1–1/2 or shEPHB1–1/2 were plated, and percentage of confluence was measured over time using Incucyte live imaging (n = 5 wells per treatment). Data analyzed with repeated measures ANOVA followed by multiple comparison post hoc corrections. ****, P < 0.001 at the last time point.