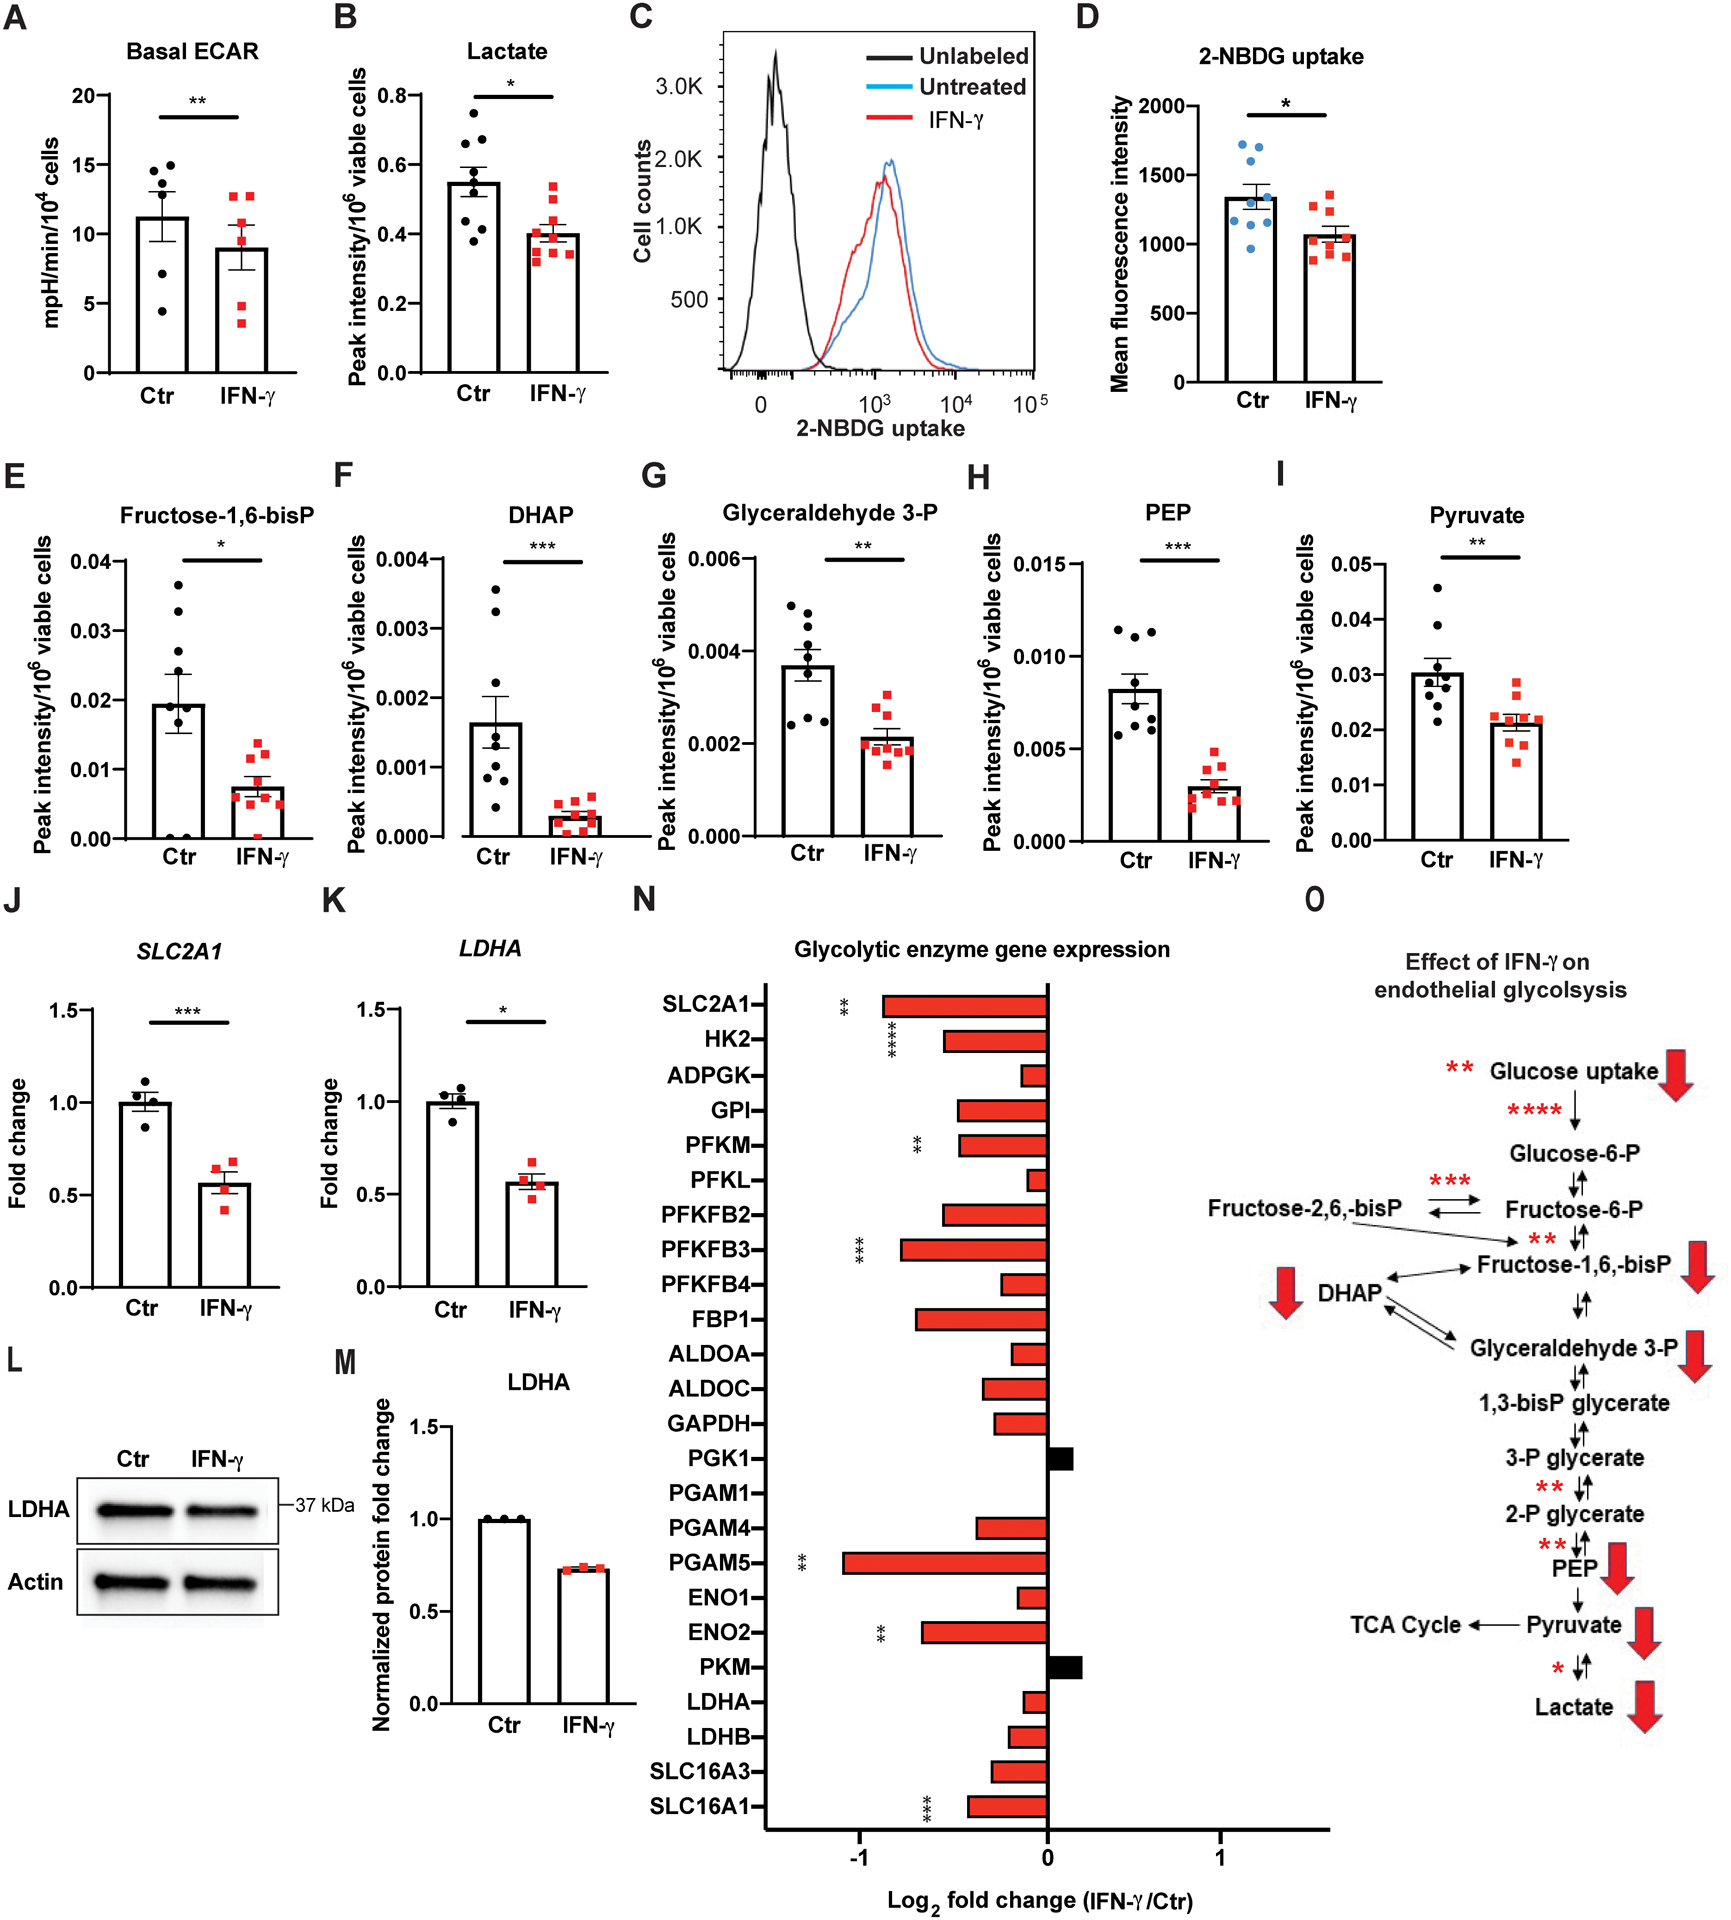
Figure 1. IFN-γ impairs basal glucose metabolism in HCAEC via global transcriptional suppression of glycolytic enzymes.

A, Real time extracellular flux analysis of extracellular acidification rate (ECAR) of HCAEC following 24 h of IFN-γ treatment at 50 ng/ml. Data represent mean ± SEM from 6 independent experiments.
B, Intracellular lactate levels in HCAEC measured by LC-MS following the same IFN-γ treatment. Mean ± SEM from 9 biological replicates from 3 independent experiments.
C-D, Cellular uptake of the glucose analogue 2-NBDG by HCAEC assessed by flow cytometry following 48 h of IFN-γ treatment. Mean ± SEM from 9 biological replicates from 3 independent experiments.
E-I, Intracellular metabolites of the glycolytic pathway in HCAEC measured by LC-MS following 24 h of IFN-γ treatment. Mean ± SEM from 9 biological replicates from 3 independent experiments.
J-K, Gene expression changes of SLC2A1 (J) and LDHA (K) measured by real-time PCR in HCAEC following the same IFN-γ treatment. Mean ± SEM from 4 independent experiments. Statistical significance was assessed using paired (A) or unpaired (D) two-tailed Student’s t-tests, unpaired Welch’s t-tests (B, E, I-J), and Mann-Whitney U tests (F-H, K).
L-M, Protein expression changes of LDHA by western blot in HCAEC following 24–48 h of IFN-γ (L) and densitometric quantification of 3 independent experiments (M).
N, IFN-γ induced gene expression changes involving the glycolytic enzymes by RNASeq analysis of HCAEC obtained in biological triplicates. Statistical significance was determined based on the p-values adjusted for multiple test hypotheses by Benjamini-Hochberg procedure with a false discovery rate threshold of < 0.05.
O, Summary of IFN-γ impairment of HCAEC glycolysis at the transcriptional (asterisks) and metabolite (red arrows) levels. Red arrows denote the significantly decreased intracellular metabolites measured by LC-MS while asterisks indicate the significantly decreased gene expressions of the enzymes involved in the reactions and the extents of the statistical significance.
* p < 0.05, ** p < 0.01, *** p < 0.001, **** p < 0.0001
ADPGK: ADP dependent glucokinase, ALDO: Aldolase, DHAP: Dihydroxyacetone phosphate, ENO: Enolase, FBP1: Fructose-bisphosphatase 1, Fructose-1,6-bisP: Fructose-1,6,-bisphospate, Fructose-2,6-bisP: Fructose-2,6,-bisphospate, Fructose-6-P: Fructose-6-phosphate, GAPDH: Glyceraldehyde 3-phosphate dehydrogenase, GPI: Glucose-6-phosphate isomerase, Glucose-6-P: glucose-6-phosphate, Glyceraldehyde 3-P: glyceraldehyde 3-phosphate, HK: Hexokinase, IFN: Interferon, PFK: Phosphofructokinase, SLC2A1: Solute carrier family 2 Member 1, PEP: Phosphoenolpyruvate, PFKFB: 6-Phosphofructo-2-kinase/fructose-2,6-biphosphatase, PGAM: Phosphoglycerate mutase 1, PGK: Phosphoglycerate kinase, PKM: Pyruvate kinase M, LDH: Lactate dehydrogenase, SLC16A1: Solute carrier family 16A member 1 (encodes monocarboxylate transporter 1), and SLC16A3: Solute carrier family 16A member 3 (encodes monocarboxylate transporter 4), TCA: tricarboxylic acid, 1, 3-bisP glycerate: 1,3-bisphosphoglycerate, 2-NBDG: 2-(N-(7-nitrobenz-2-oxa-1,3-diazol-4-yl)amino)-2-deoxyglucose, 2-P glycerate: 2-phosphoglycerate, 3-P glycerate: 3-phosphoglycerate.
