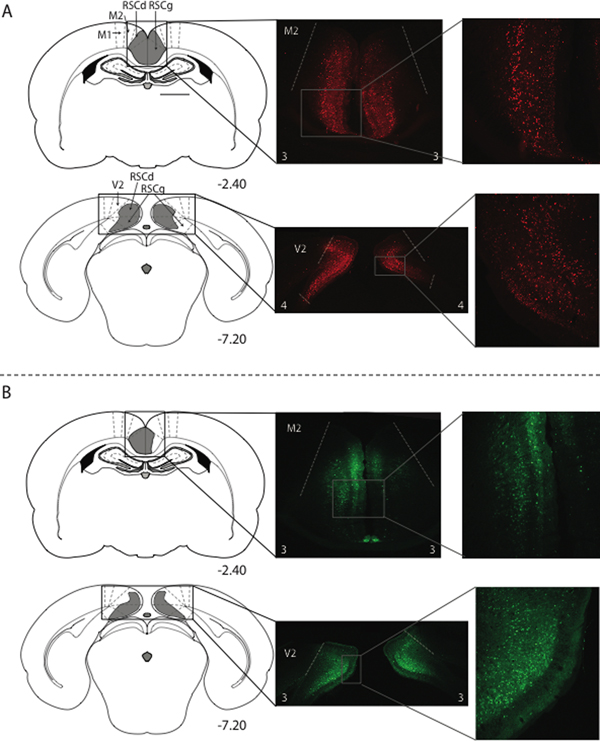
Figure 1.
Histology results from experiment 1a and 1b. Virus expression in anterior and posterior portions of the RSC in a rat from the hM4Di-mcherry group (A) and a rat from group GFP (B) Schematics in the left column depict the extent of virus expression within the RSC, with the numbers below each section indicating the A/P position in mm relative to bregma based on Paxinos and Watson (2009). Low magnification (middle column) and high magnification (right column) images show virus-expressing cells. The white numbers at the bottom of each photomicrograph in the middle column indicate the expression rating for that section. M2 = secondary motor cortex; RSCd = restrosplenial dysgranular; RSCg = retrosplenial granular, V2 = secondary visual cortex. GFP = AAV- hSyn-GFP and hM4Di = AAV-hSyn-hM4D(Gi)-mcherry.

