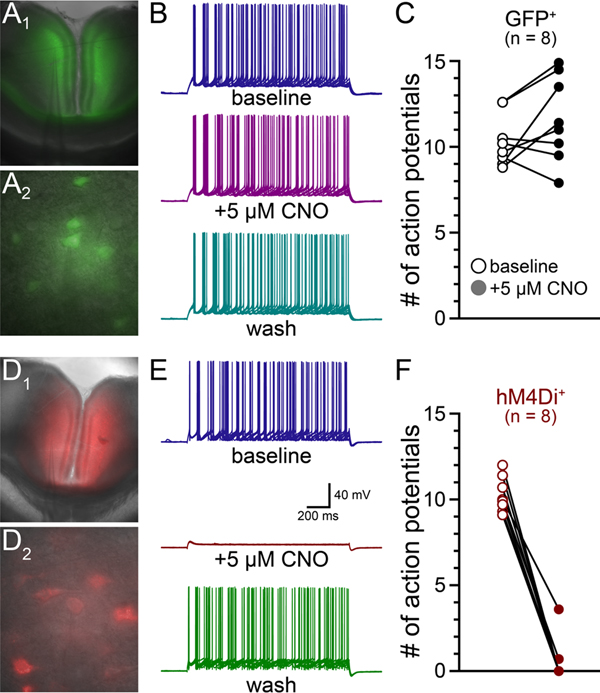
Figure 6.
Results from experiment 4. Representative images of control virus (GFP) expression at low (A1) and high (A2) magnification. Ten consecutive traces in response to identical depolarizing current steps in a GFP-expressing neuron in baseline conditions, in the presence of 5μM CNO, and after washout (B). Results of 5μM CNO application on the number of action potentials in GFP-expressing neurons (C). Representative images of hM4Di-mcherry expression at low (D1) and high (D2) magnification. Ten consecutive traces in response to identical depolarizing current steps in a hM4Di-expressing neuron in baseline conditions, in the presence of 5μM CNO, and after washout (E). Results of 5μM CNO application on the number of action potentials in hM4Di-expressing neurons (F).

