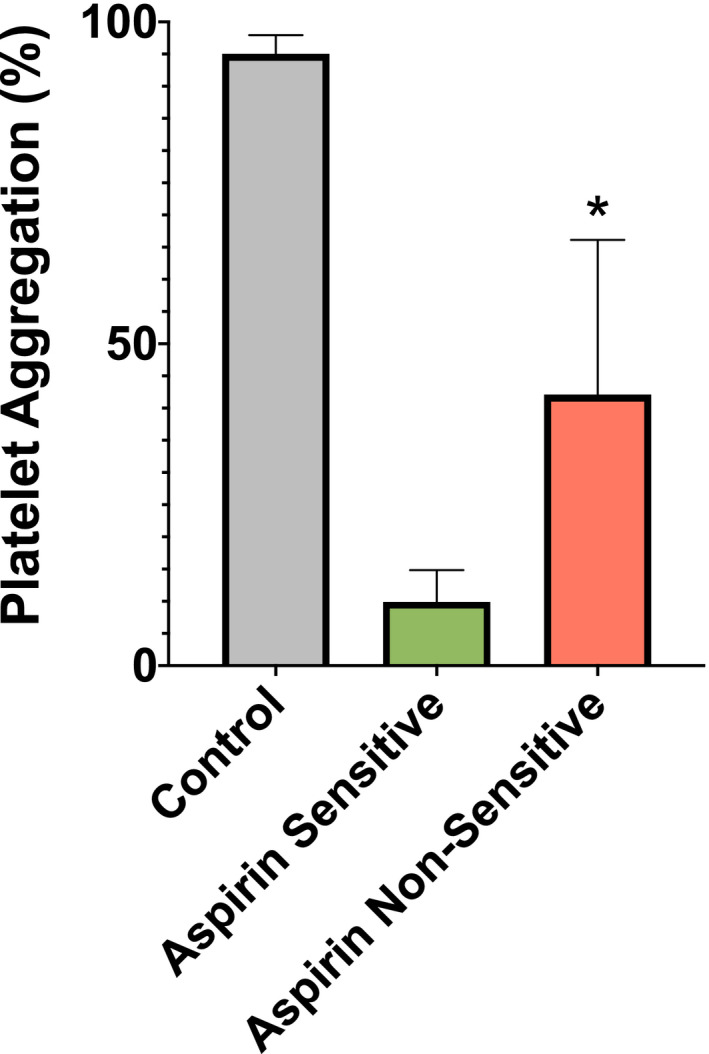
FIGURE 1.

Mean percent platelet aggregation in aspirin‐sensitive (green) and aspirin‐nonsensitive (red) patients with vascular disease and control patients not taking aspirin (gray). Aspirin sensitivity was tested in patients with vascular disease taking 81 mg of aspirin daily using light transmission aggregometry. Bar chart depicts the mean percent maximal aggregation in response to 0.5 mg/ml lyophilized arachidonic acid arachidonic acid–induced platelet aggregation. Participants were grouped into aspirin‐sensitive (n = 114, mean = 10 ± 5), aspirin‐nonsensitive (n = 36, mean = 42 ± 24), and control patients not taking aspirin (n = 10, mean = 95 ± 3). Patients were grouped as aspirin nonsensitive if maximal aggregation in response to arachidonic acid was ≥20%. Error bars represent standard deviation of the mean. Significant difference in platelet aggregation between aspirin‐sensitive and aspirin‐nonsensitive patients is represented by (*) with P value = .001
