Figure 1.
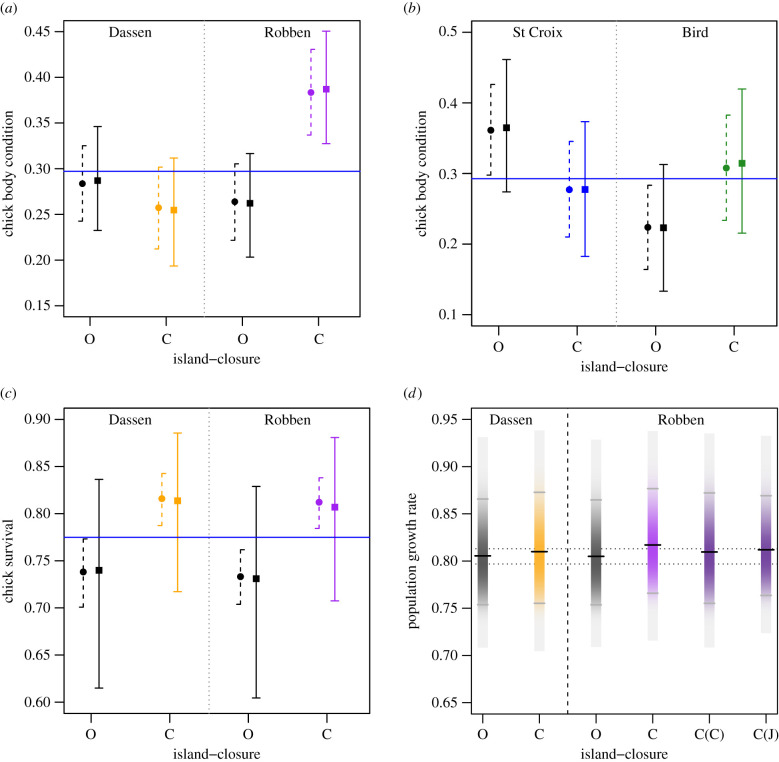
African penguin Spheniscus demersus chick body condition (a and b), chick survival (c) and population growth rate (λ) (d) at four penguin breeding colonies when a 20 km radius around the respective island was open to purse-seine fishing (O, open) or was closed to purse-seine fishing (C, closed). ‘Open’ results are shown in black, ‘closed’ are in orange for Dassen Island, purple for Robben Island, blue for St Croix Island, and green for Bird Island. In (a–c) circles and dashed lines show the published mean (calculated at mean prey biomass) and 95% credible intervals (CRI) presented in the original published paper [1], which were based on models where the hierarchical random effect (frailty term in (c)) was incorrectly implemented in JAGS [2], while squares and solid lines show the mean and 95% CRI based on the models with the correctly specified hierarchical random effect (month nested in year for condition, nest identity nested in year for survival) implemented in JAGS. In (d) black horizontal lines denote the posterior mean, grey horizontal lines the 95% CRI and the light grey extremes of each bar show the range of the posterior distribution. The dashed black lines show a 1% change in baseline population growth rate, ‘C(C)’ indicates a model run for Robben Island where only chick survival (ϕc) was improved, ‘C(J)’ where only juvenile survival (ϕj) was improved. These population projection models are based on the updated results (squares and solid lines) in (a) and (c): they show essentially unchanged results from the models published in the original paper [1] (table 1). (Online version in colour.)

