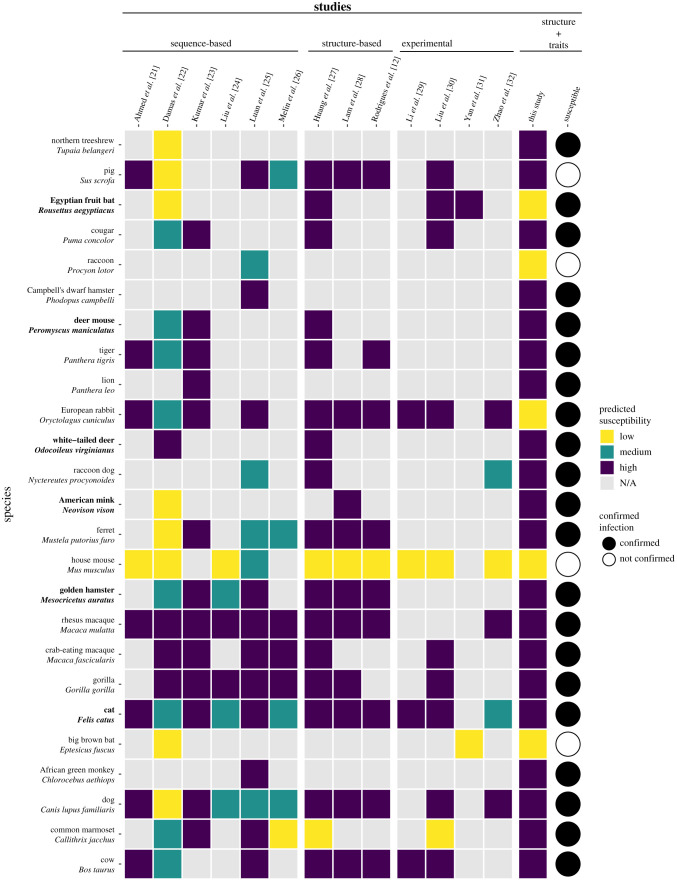
Figure 1.
A heatmap summarizing predicted susceptibility to SARS-CoV-2 for species with confirmed infection from in vivo experimental studies or from documented natural infections. Studies that make predictions about species susceptibility are shown on the x-axis, organized by the method of prediction (those relying on ACE2 sequences, estimating binding strength using three-dimensional structures, or laboratory experiments). Predictions about zoonotic capacity from this study are listed in the second to last column, with high and low categories determined by zoonotic capacity observed in Felis catus. Confirmed infections for species along with the y-axis are depicted as a series of filled or unfilled circles. Bolded species have been experimentally confirmed to transmit SARS-CoV-2 to naive conspecifics. Species predictions range from warmer colours (yellow: low susceptibility or zoonotic capacity for SARS-CoV-2) to cooler colours (purple: high susceptibility or zoonotic capacity). See electronic supplementary material, Methods [20] for detailed methods about how predictions from past studies were categorized as low, medium or high. For a comparison of predictions of species susceptibility from multiple methods, including our study, see electronic supplementary material, figure S1. (Online version in colour.)

