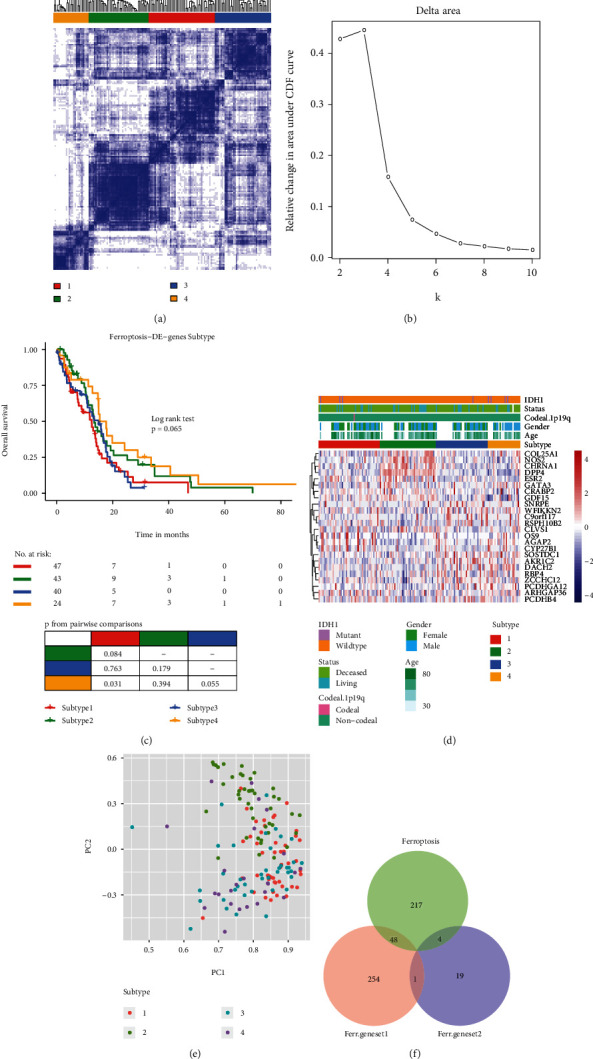
Figure 3.

Identification of candidate ferroptosis genes in GBM samples. (a) Heatmap showing optimal consensus cluster effect (four subtypes), white (not clustered), and blue (clustered). (b) AUC of cumulative distribution function (c, d, and f). (c) Overall survival of patients among subtypes. (d) Heatmap showing DEG expression levels in four subtypes. (e) PCA showing expression levels in four subtypes. (f) Venn diagram of two categories of newly identified genes (cd-Ferr-Geneset1; cd-Ferr-Geneset2) and known ferroptosis genes. GBM: glioblastoma multiforme; AUC: area under curve; DEGs: differentially expressed genes; PCA: principal component analysis.
