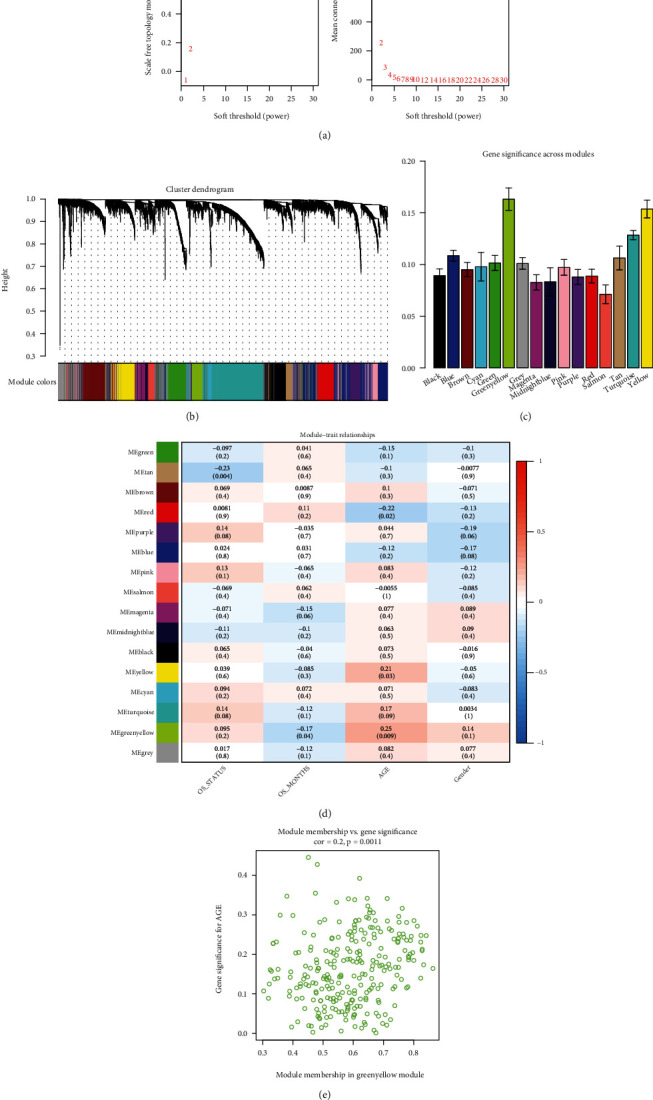
Figure 4.

WGCNA of gene expression level in GBM. (a) Distribution diagram of soft threshold and mean connectivity. (b) Hierarchical cluster displaying various modules. Different colours represent genes in different modules; grey = unclassified genes. (c) Gene significance across modules. Average correlations among various module genes and clinical phenotypes. (d) Association analysis of module genes and clinical phenotypes; red (positive correlation), and blue (negative correlation). (e) Scattergram of correlations between green-yellow modules and the clinical age phenotypes. WGCNA: weighted gene coexpression network analysis; GBM: glioblastoma multiforme.
