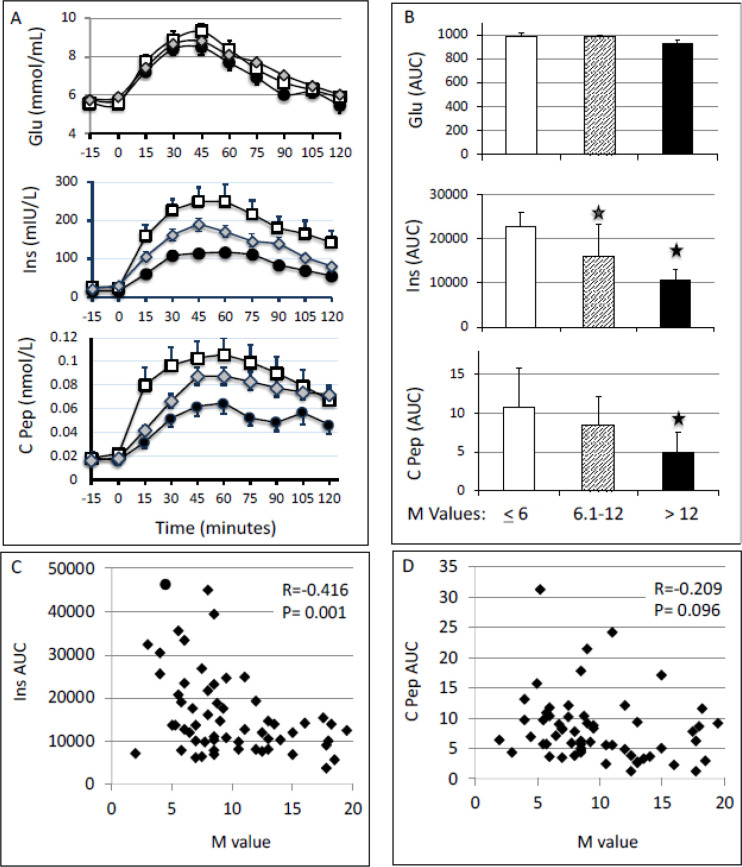
Figure 3.
(A) Plasma concentrations of glucose (mmol/L), insulin (mIU/L) and C peptide (nmol/L) during 75 g OGTT. White square: most sensitive group (M>12); gray diamond: intermediate sensitive group (M=6.1–12); and black circle, least sensitive group (M≤6). (B) AUCs for the glucose, insulin and C peptide responses during OGTT were calculated using the trapezoid method. One-way analysis of variance followed by Bonferroni statistical test was performed for multiple comparisons. *P<0.01 versus M≤6. (C and D) Correlation between M values and the AUC of insulin (C) and C peptide (D) responses to OGTT. AUC, area under the curve; C pep, C peptide; Ins, insulin; M value, whole-body glucose disposal rate; OGTT, oral glucose tolerance test.

