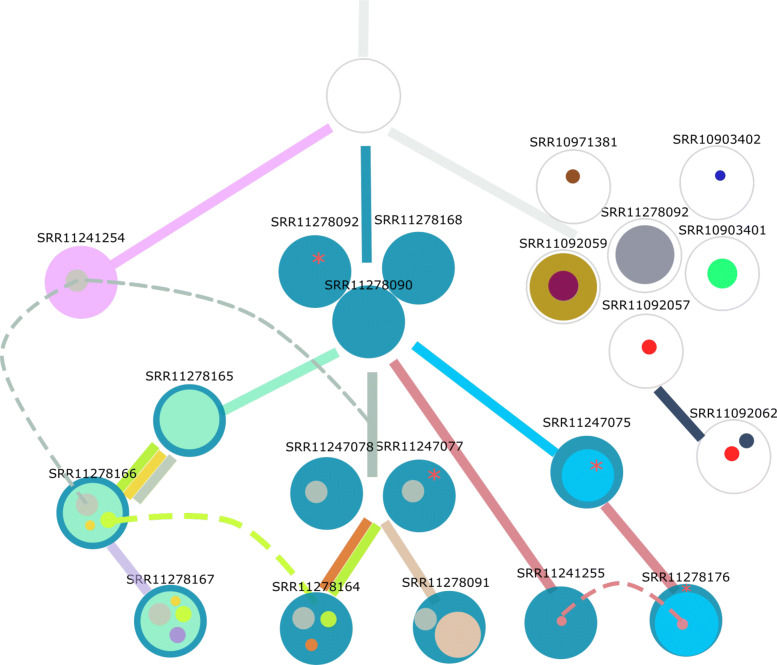
Fig. 3.
The 21 COVID-19 patients are shown at different internal and leaf nodes in the phylogeny as stacked disks of different colors. Each color corresponds to a distinct sublineage identified by a set of alterations and the size is roughly proportional to its observed prevalence value. Where possible, the edges of the phylogeny are colored by the emerging sublineage(s). When a node has multiple individuals, it indicates that there is not enough evidence to delineate the distinctions in the phylogeny. The three homoplasies (parallel mutations) are shown by dashed transversal lines. While in two (raspberry, green colors) the alteration event occurred at least twice, in the third (gray color) the alteration occurred at least three times. Furthermore, if the date of collection of a sample at a child node precedes the date at a parent node, it is within a window of a week

