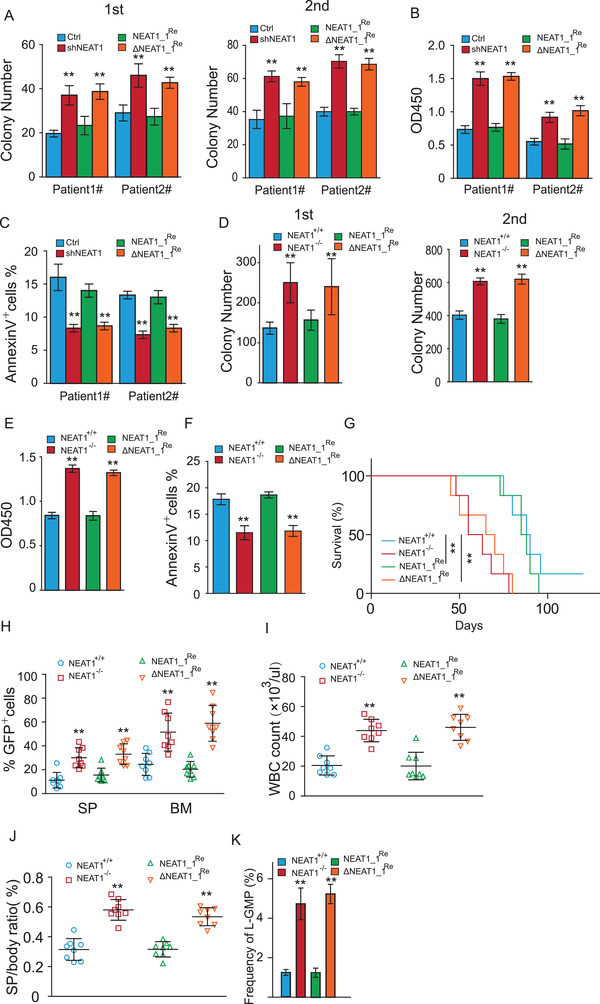
Figure 7.

NEAT1_1 suppresses leukemogenesis through inactivating Wnt signaling. A–C) Colony formation (A), proliferation (B), and apoptosis (C) of primary CD34+ LSCs from diagnostic (#1) and relapsed (#2) AML patients when total NEAT1 was knocked down (shNEAT1), restored with NEAT1_1 (NEAT1_1Re), or the 0–200 bp sequence (ΔNEAT1_1Re) was restored. D–F) Colony formation (D), proliferation (E), and apoptosis (F) of primary lin− cells transducing with FLT3‐ITD‐GFP. Lin− cells were isolated from wild‐type (NEAT1+/+) and NEAT1 knockout (NEAT1−/−) murine bone marrow, and restored with NEAT1_1 (NEAT1_1Re) or NEAT1 lacking 0–200 bp sequence (ΔNEAT1_1Re). G) Kaplan–Meier survival plots of bone marrow transplantation recipient mice (n = 6, each group). H) Percentage of GFP positive cells in spleen (SP) and bone marrow (BM) of recipient mice transplanted with FLT3‐ITD‐GFP‐transformed NEAT1+/+, NEAT1−/−, NEAT1_1Re, and ΔNEAT1_1Re lin− cells (n = 8, each group). I) White blood cell (WBC) count in peripheral blood (PB) of recipient mice (n = 8, each group). J) Spleen weight of recipient mice (n = 8, each group). K) Percentage of L‐GMP cells in recipient mice (n = 8, each group). The data represent the mean ± SD in (A–F) and mean ± S.E.M. in (H–K). P‐value was calculated based on log‐rank test in (G) and a Student's t‐test in other figures. *p < 0.05; **p < 0.01.
