
Figure 3.
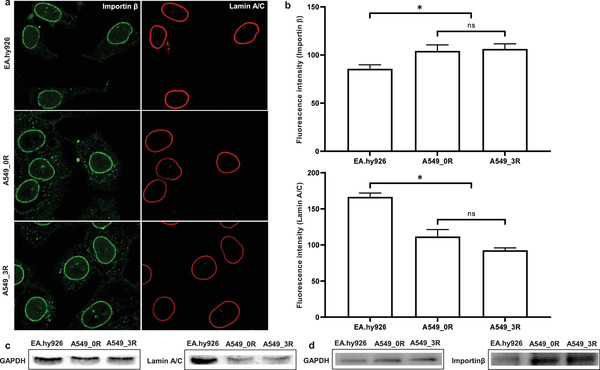
Lamin A/C levels in non‐cancer (EA.hy926) versus cancer cells (A549_0R and A549_3R). a) Immunofluorescence staining of NPCs (importin β) and lamin A/C (anti‐lamin C antibody). N = 3, and n ≥ 100 cells each. b) Importin β and lamin A/C fluorescence intensity quantification after analysis of cells (n = 20) from each experiment (N = 3) where the averaged intensity was determined from 3 different sections of each cell. c) Western blotting of the expression levels of lamin A/C in EA.hy926, A549_0R, and A549_3R cells. d) Western blotting of the levels of importin β in EA.hy926, A549_0R, and A549_3R cells. Data are shown as the mean ± SEM. Significant statistical differences (P < 0.05, one‐way analysis of variance followed by Bonferroni's multiple comparison test) exist between A549_0R‐A549_3R and EA.hy926 but none between A549_0R and A549_3R (N ≥ 3). The housekeeping protein GAPDH is used as a loading control. Scale bars are 10 µm each.