Figure 3.

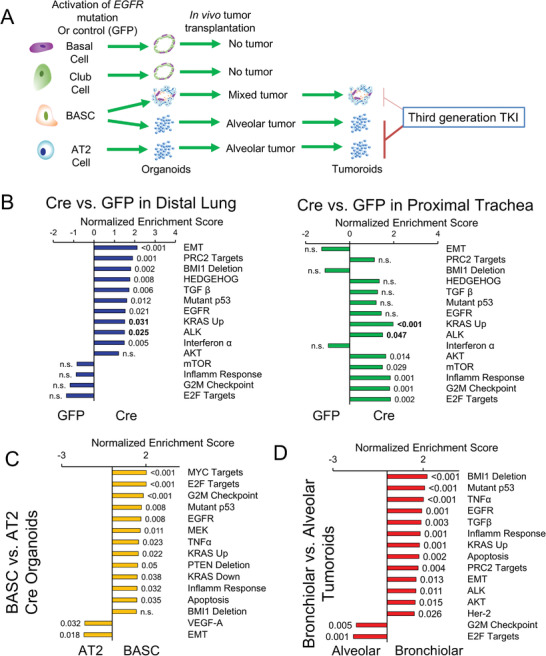
Different stem/progenitor cells drive distinct gene expression during malignant transformation. A) Schematic of RNA‐sequencing samples from organoids with indicated treatment. B) Bar plots of normalized enrichment scores of selected gene signatures enriched in Ad‐Cre treated distal lung (left) or proximal trachea (right) organoids relative to Ad‐GFP treated organoids, with false discovery rate (FDR) q‐values indicated outside the end of bars, q values in bold are pathways significant in both distal lung and trachea. C) Bar plots of normalized enrichment scores of selected gene signatures enriched in BASC‐derived organoids relative to AT2‐derived Ad‐Cre treated organoids, with FDR q‐values indicated outside the end of bars. D) Bar plots of normalized enrichment scores of selected gene signatures enriched in bronchiolar tumoroids relative to alveolar tumoroids, with FDR q‐values indicated outside the end of bars.
