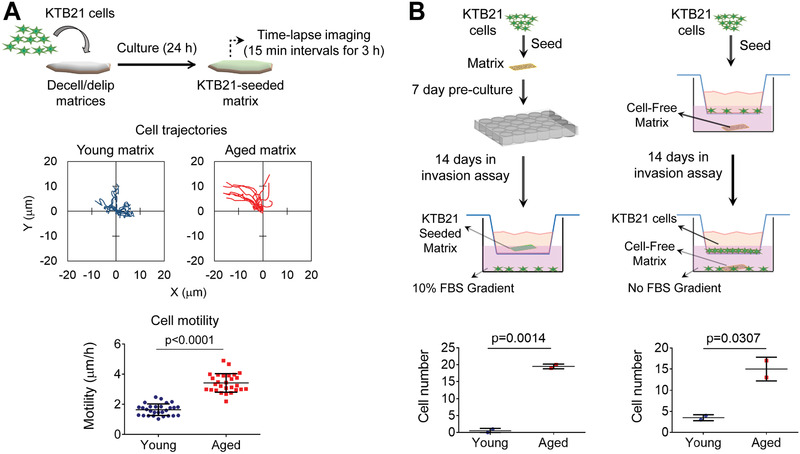
Figure 2.

Aged breast ECM induces KTB21 cell migration and invasion. A) Cell migration on matrices calculated from time‐lapse images taken at 15 min intervals for 3 h. Top: cell trajectories, bottom: motility. Also see Movies S1 and S2. B) Cell invasion through transwell inserts. Left: invaded cell number against FBS gradient. n = 2 matrices. Right: invaded cell number towards cell‐free matrices in the bottom chamber. n = 2 matrices. Data are presented as the mean ± SD. Statistical tests: two‐tailed student's t‐test.
