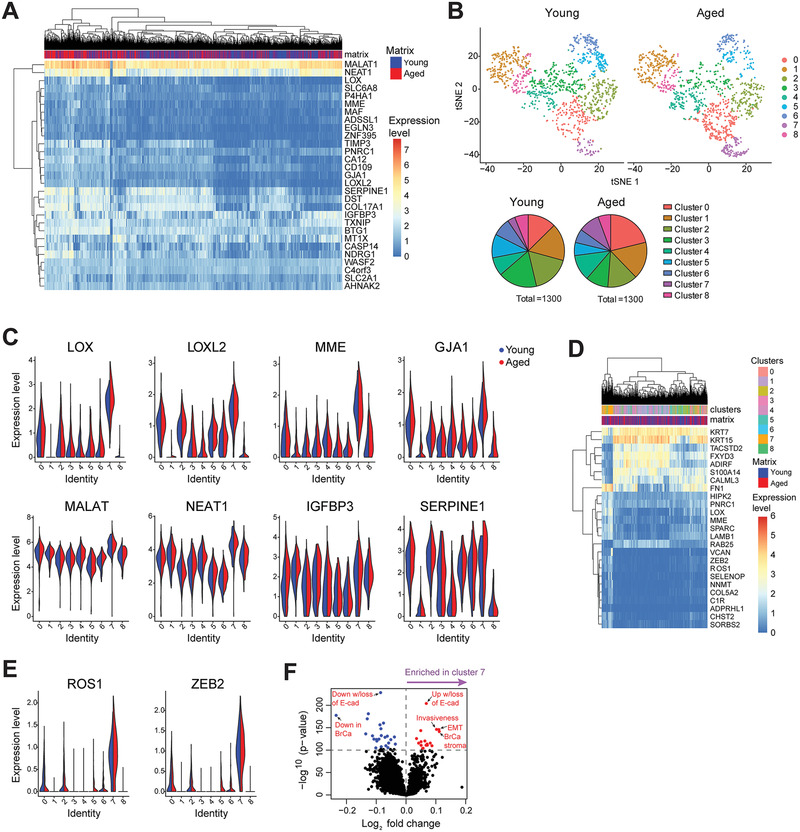
Figure 4.

scRNA‐seq of KTB21 cells incubated for 20 days on young and aged matrices reveals upregulation of invasion and migration related genes and enrichment of an invasive sub‐population on the aged matrices. A) Genes significantly upregulated in cells on the aged matrix. B) Clustering of cells on matrices after down‐sampling. Top: t‐SNE showing the transcriptional differences between cells and clusters within each matrix type (closer cells have similar transcriptomes). Bottom: pie charts comparing the cell cluster sizes on a specific matrix type based on the cell numbers belonging to a specific cluster. C) Expression of the invasion and migration related genes that have upregulated on the aged matrices in cell clusters. D) Genes significantly differentially expressed in cluster 7 cells compared to cells in other clusters. E) Genes significantly upregulated in cluster 7 cells. F) ssGSEA showing enrichment of invasion and EMT‐associated gene sets in cluster 7 cells. n = 1300 cells/matrix type, pooled from 2 independent biological replicates. Adjusted p < 0.05.
