
FIGURE 1.
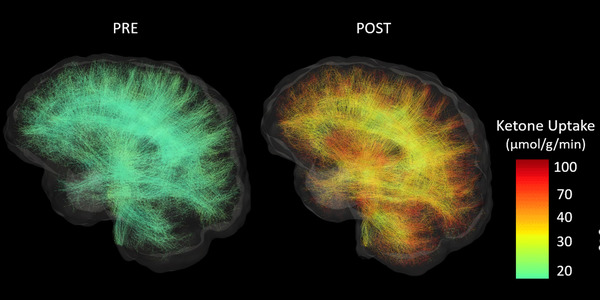
Whole‐brain white matter tractograms from a sample participant in the ketogenic medium chain triglyceride (kMCT) group before (PRE) and after (POST) the 6‐month intervention. Streamlines are colored according to their acetoacetate metabolic rate (μmol/g/min). Subsets of 10,000 streamlines per whole‐brain tractogram are shown.