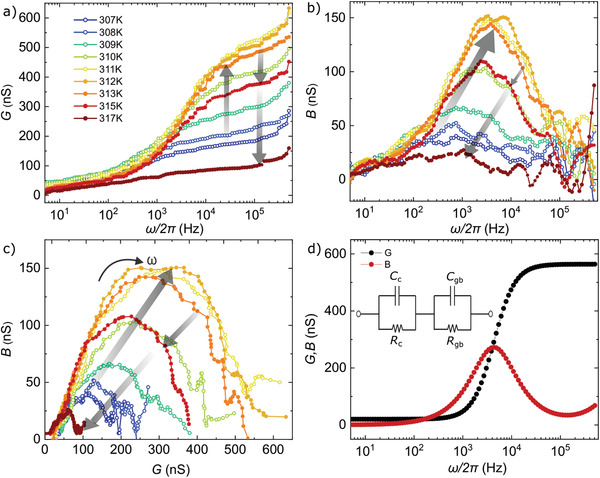
Figure 2.

Frequency spectrum of a) the conductance G and b) the susceptance B measured at different temperatures in a 1·2CH3CN crystal (sample 3). The grey arrows indicate increasing (empty dots) and decreasing (filled dots) G and B with temperature. c) Nyquist representation of the admittance. A full semicircle spans over most of the frequency range, while a small high‐frequency tail can be observed for the highest and lowest temperatures. Gray arrows indicate the shift of the curves under increasing temperature. d) Theoretical G and B curves reproducing the experimental results by using two parallel RC circuits connected in series. Each subcircuit accounts for the bulk (C c , R c ) and grain boundaries (C gb , R gb ) contributions.
